On the surface, October looks like another slow month. GTA home sales fell 7.9% from last year to 5,603. The average price fell 2.7% to $1,024,108. New listings dropped 11.9%. Many buyers are still waiting on the sidelines.
Underneath, the gap with last year is closing fast. In September, prices were down 5.1% year over year. In October, that drop shrank to 2.7%. In the city, detached and semi-detached homes are now almost exactly where they were a year ago. The average GTA price is also up about 5% since January.
Then, on October 28, the Bank of Canada raised its rate to 2.5%. Prices have held steady all year. The question now is whether they can keep holding as borrowing costs climb.
October 2026 Market Overview
| GTA | Oct 2025 | Oct 2026 | Change |
|---|---|---|---|
| Sales | 6,083 | 5,603 | –7.9% |
| Average Price | $1,052,539 | $1,024,108 | –2.7% |
| New Listings | 16,080 | 14,173 | –11.9% |
| Active Listings | 27,899 | 25,098 | –10.0% |
| Avg. Days on Market | 31 | 31 | 0.0% |
| SNLR | 37.8% | 39.5% | +1.7 pts |
Source: TRREB MLS data.
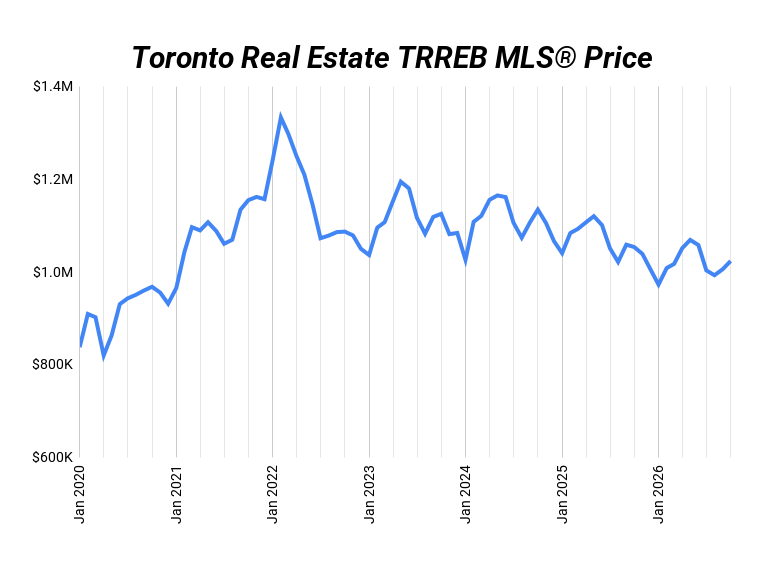
Year over year, every main number is lower. But a year-over-year drop compares one October to the last. It doesn’t show what happened in between. The average price fell hard in late 2025, down to about $973,000 in January. Since then it has climbed back to $1,024,108, up from $1,006,409 in September. So prices are lower than a year ago, but they are not falling right now.
Supply is normal. New listings were 14,173, right in line with the 10-year October average of about 14,140. The pile of homes for sale shrank 10% from last year, to 25,098. Sellers aren’t flooding the market. The extra listings we saw in 2024 and 2025 have worked their way through.
Demand is the weak spot. Sales were 26% below the 10-year October average of about 7,530. Today’s average price sits between 2020 and 2022 levels, and 23% below the February 2022 peak of $1,334,045. Remember, price is always the last thing to change. Supply and how fast homes sell move first. Right now both are slowly tilting toward sellers.
What Is SNLR and Why It Matters
SNLR, the sales-to-new-listings ratio, is one of the simplest ways to see whether buyers or sellers have the upper hand.
| Seller’s Market (Over 60%) More than 6 of every 10 new listings sell. Homes go fast, and sellers can push on price. |
| Balanced Market (40% to 60%) Buyers and sellers are on fairly even ground. Neither side has much extra power. |
| Buyer’s Market (Under 40%) Fewer than 4 of every 10 new listings sell. Buyers have more choice and more room to negotiate. |
| October SNLR | 2022 | 2023 | 2024 | 2025 | 2026 | Long-Run Avg. |
|---|---|---|---|---|---|---|
| All TRREB | 47% | 32% | 43% | 38% | 39.5% | 55% |
| 416 Semi | 60% | 43% | 56% | 55% | 52% | 67% |
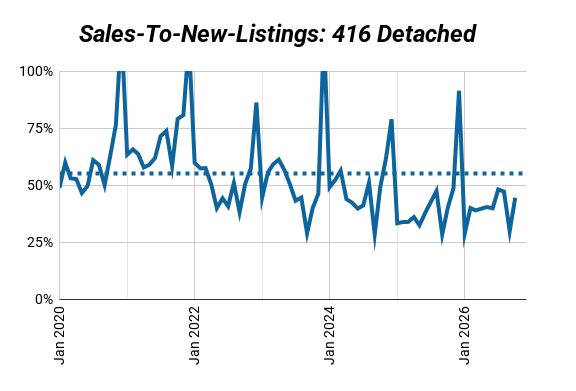
| 416 Detached | 51% | 40% | 49% | 40% | 45% | 55% |
| 905 Detached | 47% | 32% | 45% | 37% | 39% | 55% |
| 416 Condo | 41% | 28% | 37% | 36% | 35% | 51% |
Source: TRREB MLS data.
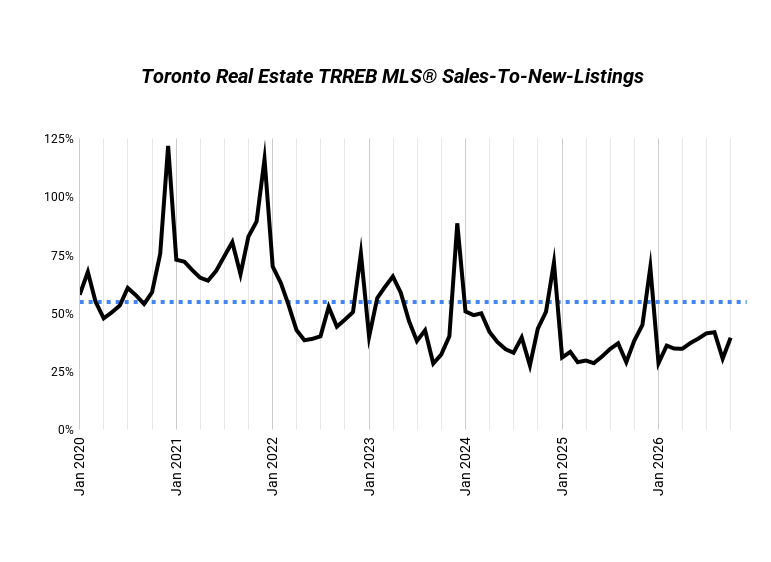
The GTA sits at 39.5%, just one point short of a balanced market. That’s up from 37.8% last October. Sales didn’t rise much. The ratio improved because fewer new listings came on the market.
The biggest move was 416 detached homes. Their SNLR jumped from 40% to 45%, which puts them in balanced territory. 416 semis stayed balanced at 52%. Both are still below where they were in October 2024, and well below their long-run averages.
Condos are the other story. 416 condos are at 35% and 905 detached homes at 39%. Both are still buyer’s markets. City houses are tightening. Condos are not.
416 vs. 905 Detached: The Big Picture
| Detached | Oct 2025 | Oct 2026 | Change |
|---|---|---|---|
| Sales | |||
| 416 | 747 | 741 | –0.8% |
| 905 | 2,109 | 1,952 | –7.4% |
| New Listings | |||
| 416 | 1,864 | 1,664 | –10.7% |
| 905 | 5,692 | 5,023 | –11.8% |
| Average Price | |||
| 416 | $1,619,047 | $1,603,886 | –0.9% |
| 905 | $1,262,161 | $1,199,303 | –5.0% |
Source: TRREB MLS data.
The 905 slowed down much more than the city. Detached sales in the suburbs fell 7.4%, while city sales were almost flat at –0.8%. Compared to the 10-year October average, 905 detached sales were 25% lower and city sales were 17% lower. New listings in both were right on their 10-year averages.
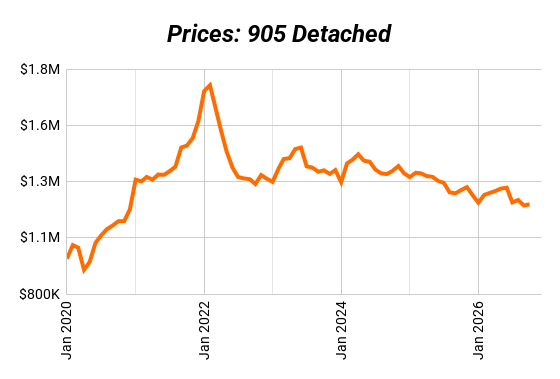
Prices tell the same story. The average 416 detached home slipped just 0.9% to $1,603,886, about where it was in October 2022. The 905 fell 5.0% to $1,199,303. That widened the gap between city and suburb from about $357,000 last year to about $405,000 today.
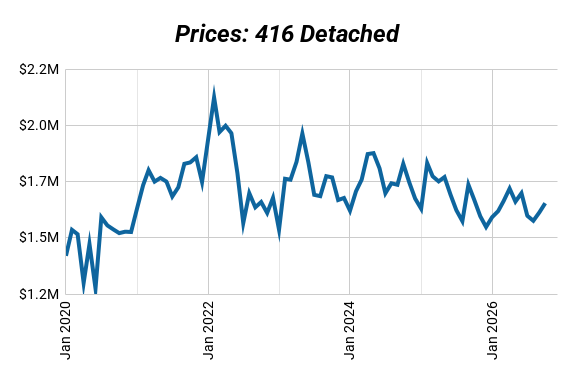
From the peak, the 905 has fallen further. It’s about 31% below its high of $1,727,963. The 416 is about 23% below its high of $2,073,989. City detached homes sold for 97% of asking and took 24 days on average. The takeaway: city houses are holding their value. The suburbs are still adjusting.
416 City Breakdown: Detached, Semi and Condo
| 416 | Oct 2025 | Oct 2026 | Change |
|---|---|---|---|
| Sales | |||
| Detached | 747 | 741 | –0.8% |
| Semi | 263 | 266 | +1.1% |
| Condo | 1,072 | 949 | –11.5% |
| New Listings | |||
| Detached | 1,864 | 1,664 | –10.7% |
| Semi | 478 | 512 | +7.1% |
| Condo | 2,967 | 2,694 | –9.2% |
| Average Price | |||
| Detached | $1,619,047 | $1,603,886 | –0.9% |
| Semi | $1,219,254 | $1,225,229 | +0.5% |
| Condo | $699,241 | $659,214 | –5.7% |
Source: TRREB MLS data.
Detached: Flat and firming. The average is $1,603,886, down just 0.9% from last year and about 5% above the 10-year October average. With fewer new listings and steady sales, 416 detached homes moved into a balanced market this month.
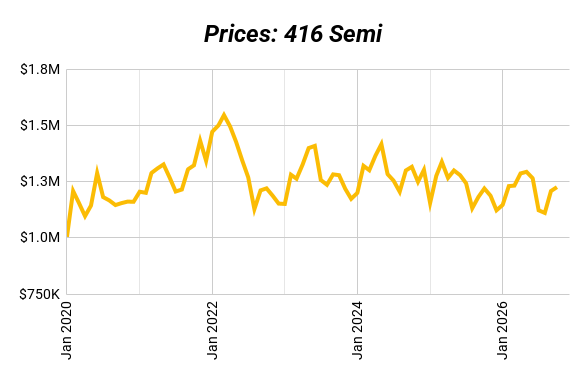
Semi: Still the strongest home type in the city. Semis were the only one with prices and sales both up from last year. The average is $1,225,229, about where it was in October 2022 and 7% above the 10-year average. They sold for 102% of asking in just 18 days. Semis are the most affordable house in the city, so buyers compete for them.
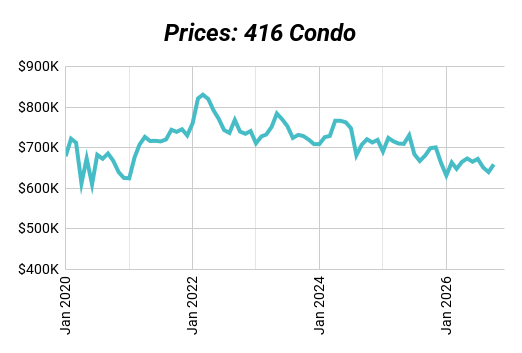
Condo: The weak spot, again. The average 416 condo is $659,214, down 5.7% and back to October 2019 levels. Sales fell 11.5% and are 31% below the 10-year October average. More than 5,200 condos were for sale at the end of the month.
Hidden Market Signals
| 416 Home Type | Sale vs. Asking | Avg. Days on Market | Homes for Sale |
|---|---|---|---|
| Semi-Detached | 102% | 18 | 546 |
| Detached | 97% | 24 | 2,708 |
| Condo Apartment | 97% | 36 | 5,251 |
Source: TRREB MLS data.
Semis are where the competition is. They sold above asking and faster than any other type. Condos sit at the other end. There are more than five condos for sale in the city for every one that sold in October. That pile keeps pressure on condo prices and on rents.
The biggest signal isn’t in the TRREB data yet. On October 28, the Bank of Canada raised its rate by 0.25% to 2.5%. Inflation has been around 3% since April, and high energy prices from the conflict in the Middle East are pushing costs up. The Bank says more hikes may be needed. Its next decision is December 9. Fixed mortgage rates were already rising in September. Here is where rates could go next.
TRREB notes that monthly payments on an average home are a bit higher than a year ago, but still much lower than in 2023 and 2024. That’s the balance to watch. Prices have held steady all year. A slow recovery looked possible, in line with income growth. Higher rates make that harder. Most likely, prices stay flat for longer rather than fall.
What Multiplex Investors Should Watch
| City Houses Are Tightening 416 detached homes just moved into a balanced market, and semis are still drawing bids. Less room to negotiate is coming. The best buys are often made before the headlines turn. |
| Rates Are Moving Up Every half point adds about 5% to a mortgage payment. Run every deal at today’s rate plus half a point and make sure it still cash flows. |
| The Condo Pile Affects Rents More than 5,200 condos are for sale in the city. Many will become rentals, which gives tenants more choice. Units with space, private entrances and outdoor areas will stand out. |
| Value Comes From the Deal In a flat market, waiting for prices to rise won’t carry a deal. Adding units under the Toronto multiplex rules or a garden suite is where the return is made. |
Before you buy, test the numbers with our investment calculator, or see this week’s best investment property deals in Toronto.
Steady Prices, Rising Rates: Buy the Numbers
October showed a market that’s finding its footing. City houses are holding their value, the yearly price drop is shrinking, and 416 detached homes are back in balance. But the Bank of Canada just raised rates, and more hikes are possible. Prices are more likely to stay flat than to climb, so a deal has to work on today’s numbers.
That’s where experience matters. Knowing which streets still draw bids, which homes can add units, and how a deal holds up if rates rise again is the difference between a property that pays you and one that costs you.
Our brokerage specializes in Toronto multiplexes. We’ll help you find deals, crunch the numbers, and guide you through renovations and management. If you want full support in Toronto multiplex investing, our team can help you:- Find high-potential properties
- Crunch the numbers so you know exactly where you stand
- Coach you through renovations to maximize returns
- Lock in great tenants
- Provide full property management so your investment runs smoothly
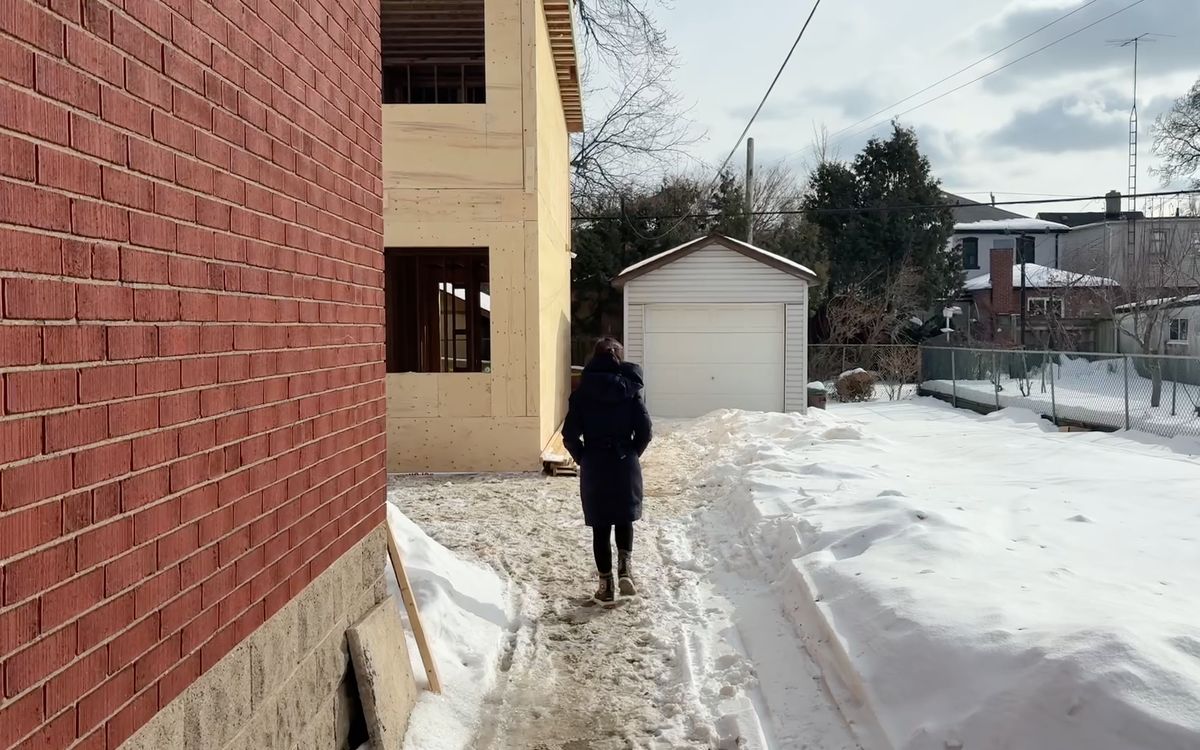
What do Toronto multiplexes really cost and earn?
We pulled the numbers from the 50+ deals we worked on in the past year: build costs, rents by unit type, and how the refinances came out. Free, and no best case.
