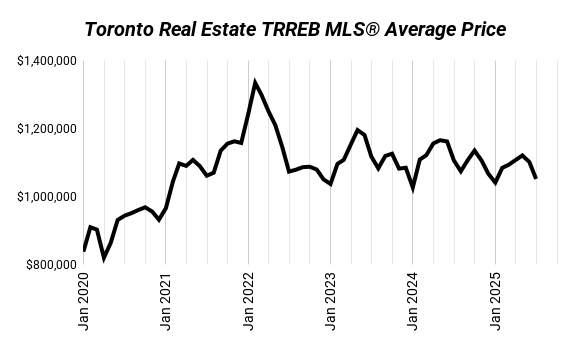
Home prices across the GTA dropped again in July. The average price fell 5% from last month to $1,051,719, now down 5% year-over-year too. But don’t let that small year-over-year number fool you — prices in some segments have dropped hard from peak.

Price Drops Since Peak – Bigger Than They Look
Since the market peaked, prices have taken a serious hit.
Condos have technically dropped the least, but that’s not necessarily a good sign. It probably just means they have more room to fall, especially considering the type of buyers they attract.
| Jun 2025 | Jul 2025 | Change | |
|---|---|---|---|
| Average Price | $1,101,691 | $1,051,719 | -5% |
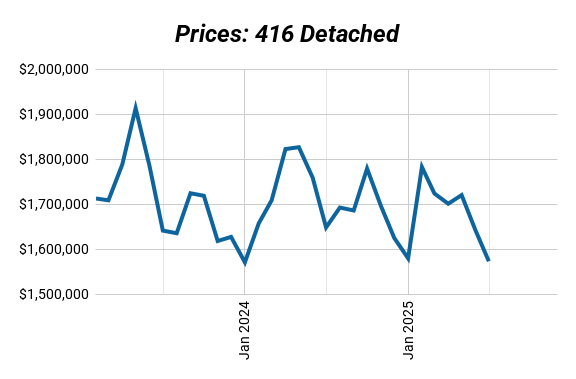
| 416 Detached | $1,641,868 | $1,572,832 | -4% |
| 416 Semi | $1,278,434 | $1,242,388 | -3% |
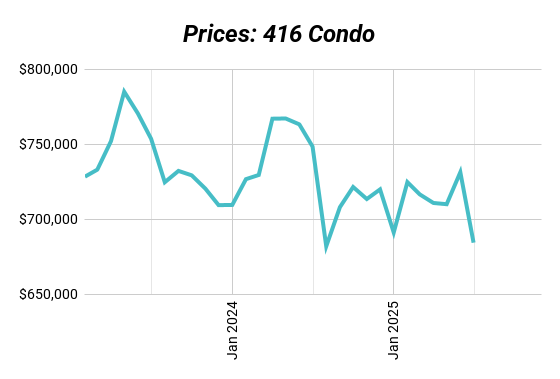
| 416 Condo | $731,232 | $684,257 | -6% |
What’s Driving the Market?
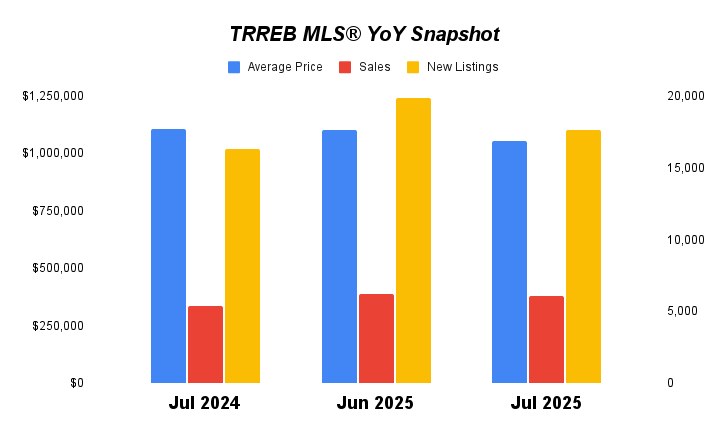
- More Buyers, But It’s Not a Boom: Sales are up 13% year-over-year, which sounds good, but this isn’t a rush of new demand — it’s buyers finally stepping in at lower prices. It’s price-driven, not confidence-driven. Month-over-month, sales actually dipped 2%.
- Listings Pulled Back, Market Tightened Slightly: New listings fell 11% from June, which nudged the sales-to-new-listings ratio (SNLR) up to 35% — up from 31% last month and 33% last year. But again, this tightening is from fewer sellers, not stronger demand.
| Metric | Jul 2024 | Jul 2025 | Change |
|---|---|---|---|
| Average Price | $1,106,617 | $1,051,719 | -5% |
| Sales | 5,391 | 6,100 | +13% |
| New Listings | 16,296 | 17,613 | +8% |
| SNLR | 33% | 35% | +5% |
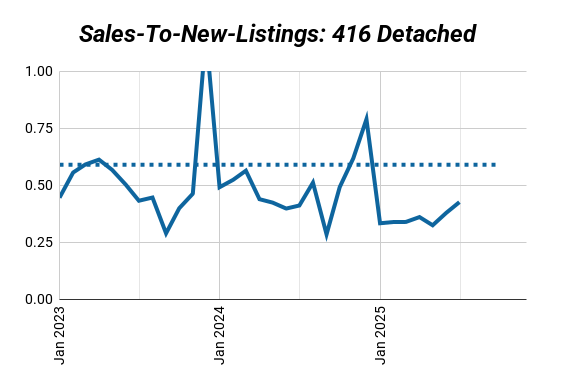
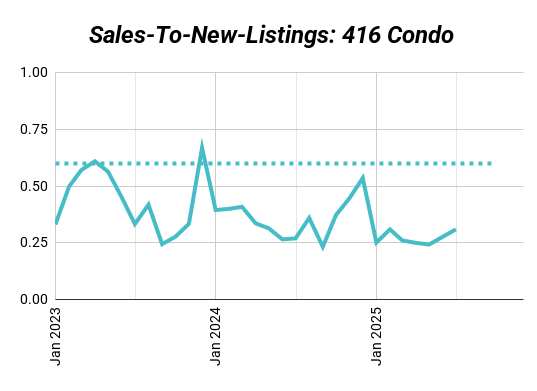
What is SNLR (Sales-to-New-Listings Ratio) and Why It Matters
The Sales-to-New-Listings Ratio (SNLR) shows how hot or cold the market is by measuring how many homes are selling compared to how many are being listed.
- Seller’s Market (SNLR above the dotted line): More buyers than sellers. Homes move fast, competition heats up, and prices usually rise.
- Buyer’s Market (SNLR below the dotted line): More listings than buyers. Homes sit longer, buyers have leverage, and prices tend to soften.
- Balanced Market (SNLR near the dotted line): Supply and demand are in sync. Prices stay relatively stable.
Every market has its own version of that dotted line, but the trend matters most — if SNLR is rising, the market’s tightening. If it’s falling, buyers are gaining ground.
By Property Type – What’s Really Going On
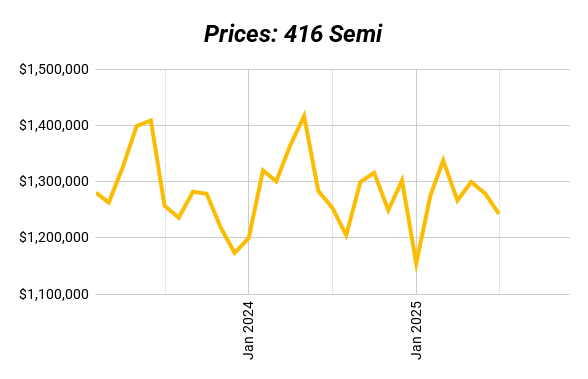
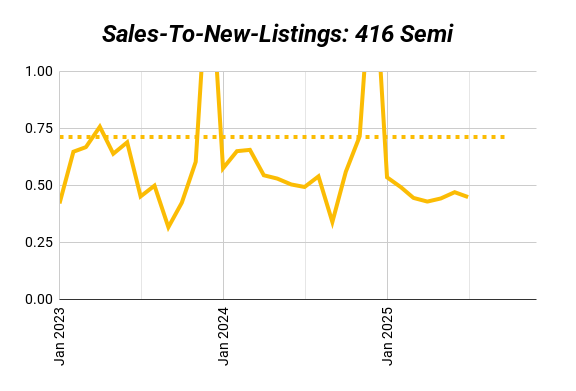
- Semis Are the Most Stable: 416 semis are holding up the best. Prices are down just 1% year-over-year and 3% from last month. Demand is still strong because these are the most affordable “real homes” for end users. People still need to live somewhere — this isn’t a speculator play, it’s end-user driven. That kind of demand is sticky.
- Detached Homes Might Be Nearing the Bottom:
- 416 detached homes are showing signs of bottoming out. Prices are already down 24% from the peak and dropped 4% in the last month. But listings are thinning out, and the SNLR is starting to improve. That’s often how floors form — slow, quiet stability before any big headlines.
- 905 detached is looking similar. Only a 1% drop from June to July, even though it’s down 25% from the peak. That might mean buyers are starting to step back in at these levels.
- Condos Are the Weakest Segment:
- Condos are falling fast now — down 6% in just one month, and 9% year-over-year. That’s where we’re seeing the most pressure, and for good reason.
- These units aren’t appealing to end users since they’re way too small and the investor math doesn’t work anymore. Negative cash flow, no short-term appreciation, and way too much new supply. Condos may not have dropped as much as houses yet, but that’s why they could still fall further.
Investor Takeaways – Focus Where Demand Is Real
There’s no panic, no crash, but the softening is real — and the opportunity is in spotting which segments are holding up and why.
If you’re investing right now:
Avoid condos unless you’re getting a deep discount — the investor math doesn’t work and resale buyers aren’t biting.
Watch 416 semis — they’re supported by end-user demand and price stability.
Detached homes (both 416 and 905) may be near the bottom. These could be your entry point if you’ve been waiting on the sidelines for prices to settle.
How We Can Help
The market’s choppy, but smart investors aren’t sitting out — they’re doubling down on what works.
We help you find the deals with real cash flow, renovation upside, and long-term value. No guessing on appreciation. No speculating on rate cuts. Just numbers that work now, and a plan that holds up no matter where the market goes.
Want to see what’s possible for you? Book a strategy session with us here.
