Toronto Real Estate Market Report: Trends Explained (October 2025)
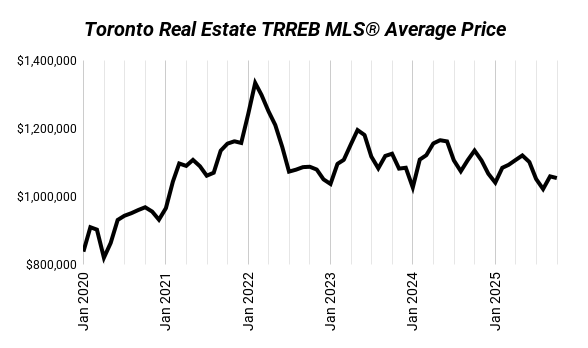
Toronto’s real estate market is still stuck in neutral, even after two rate cuts this fall brought the overnight rate down to 2.25%. The Bank of Canada has already signalled no more cuts ahead, which means the easy gains from cheaper borrowing are behind us. Prices have stopped falling, but they’re not rebounding either — and that’s telling.
We’ve moved past the crash phase, but the recovery hasn’t started. Rate cuts helped people qualify again, but they didn’t make homes feel any cheaper. That’s why the market’s still crawling.
Market Overview
Metric
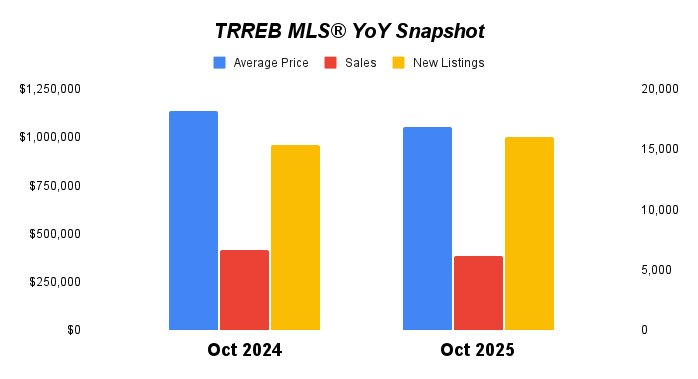
Oct 2024
Sep 2025
Oct 2025
YoY
MoM
Average Price
$1,135,215
$1,059,377
$1,054,372
-7%
-0%
Sales
6,658
5,592
6,138
-8%
+10%
New Listings
15,328
19,260
16,069
+5%
-17%
SNLR
43%
29%
38%
-12%
+32%
The market’s slipping again. Listings are rising, sales are falling, and prices are down 7% year-over-year — clear signs that conditions are weakening.
But GTA isn’t moving as one market anymore — it’s a mix of very different realities. Condos are sinking under oversupply, while semis are holding up, and detached homes are split between motivated sellers and those sitting tight. You can’t judge what’s really happening without breaking it down by segment.
The Real Story Behind the Numbers
What we’re seeing isn’t about approvals or rate relief — it’s about confidence. Even with slightly better borrowing conditions, buyers aren’t rushing in because affordability hasn’t really improved. Sellers are still anchored to old price expectations, and buyers aren’t willing to stretch. The gap between the two sides is widening, not closing.
Segment
Average Price (Oct 2025)
Change Since Peak
SNLR (Oct 2025)
Historical SNLR
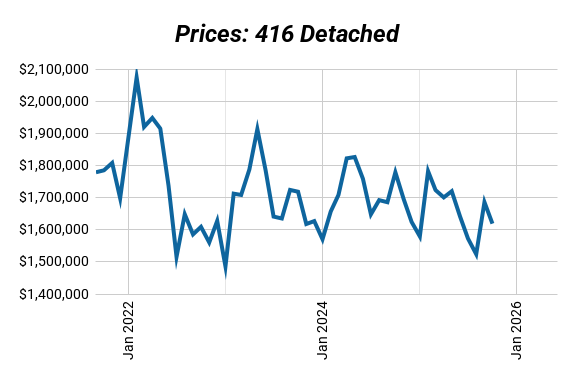
416 Detached
$1,619,047
-22%
40%
55%
416 Semi
$1,219,254
-21%
55%
67%
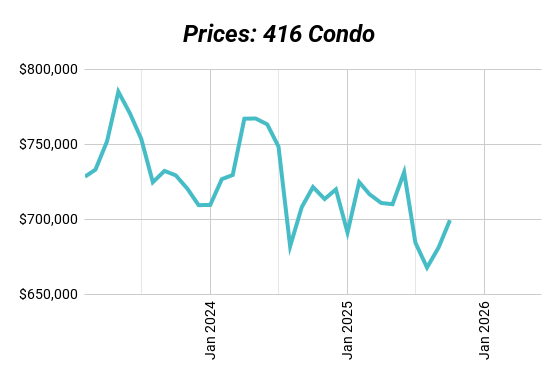
416 Condo
$699,241
-16%
36%
51%
905 Detached
$1,262,161
-27%
37%
55%
416 Detached: End-User Pressure
Detached homes have cooled off. Most activity is from end-users, not investors, and buyers aren’t rushing. Sellers who don’t have to move are waiting it out, while the motivated ones are cutting prices to get deals done. There’s no panic, just a slow, selective market.
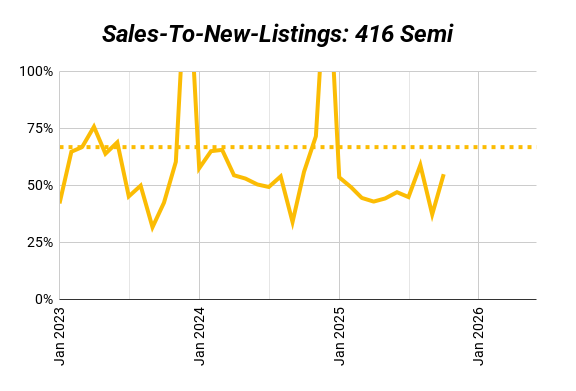
416 Semis: The Quiet Stabilizer
Semis are holding their ground. They’re the sweet spot for both families and investors — enough space, still relatively affordable, and located where people actually want to live. Limited inventory is keeping them stable even as the rest of the market wobbles.
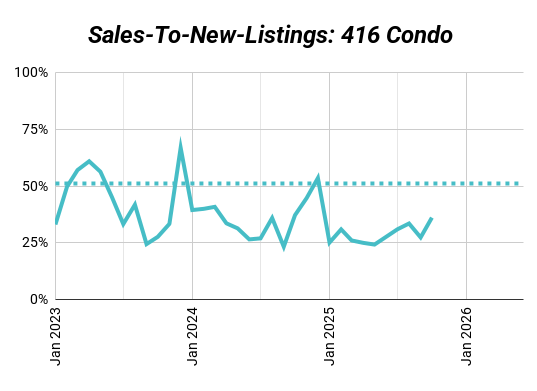
416 Condos: Structurally Weak
Condos are still the weakest part of the market. Too much supply, too few real buyers, and the only ones selling are the smaller, cheaper units. Investors holding pricier stock are stuck, and rising fees plus negative cash flow aren’t helping. With renewal and assignment pressure piling up, this segment has a rough road ahead.
905 Detached: The Riskiest Bet
The suburbs are still soft. Prices are way off their peaks and sales are thin. The problem isn’t that people can’t afford to buy out there — it’s that they don’t want to. The price gap between the city and the suburbs has basically disappeared, and with traffic and commuting back in full swing, a bigger house an hour away doesn’t feel like a win anymore. Families who could buy are sitting tight because the lifestyle trade-off just isn’t worth it.
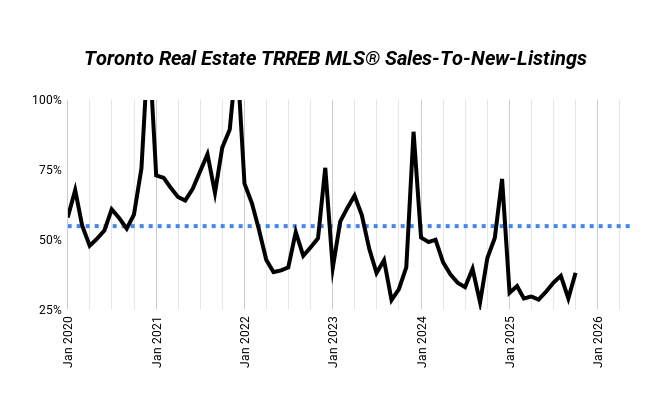
What is SNLR (Sales-to-New-Listings Ratio) and Why It Matters
The Sales-to-New-Listings Ratio (SNLR) shows how hot or cold the market is by measuring how many homes are selling compared to how many are being listed.
Seller’s Market (SNLR above the dotted line): More buyers than sellers. Homes move fast, competition heats up, and prices usually rise.
Buyer’s Market (SNLR below the dotted line): More listings than buyers. Homes sit longer, buyers have leverage, and prices tend to soften.
Balanced Market (SNLR near the dotted line): Supply and demand are in sync. Prices stay relatively stable.
Every market has its own version of that dotted line, but the trend matters most — if SNLR is rising, the market’s tightening. If it’s falling, buyers are gaining ground.
Investor Insights
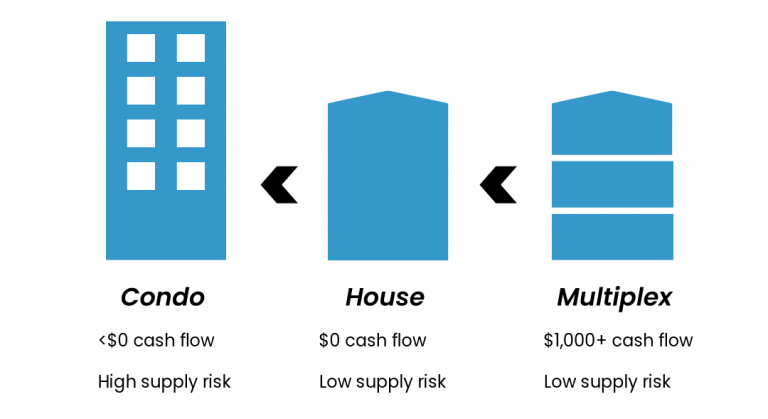
Investor behaviour has changed completely. The easy, passive investments — preconstruction or turnkey condos banking on appreciation — have disappeared. That model’s broken. Carrying costs still outpace rent, and there’s no short-term upside.
But serious investors haven’t left — they’ve evolved. The focus now is on rent strength and value-add plays: converting houses to multiplexes, adding laneway or garden suites, and repositioning properties with renovation and management upside. These are hands-on projects, but they actually cash flow and build long-term wealth.
Condos remain a poor short-term bet. The suburbs carry risk because demand confidence hasn’t returned. The sweet spot is still 416 semis and small multiplex conversions — the properties that can be improved and re-leased at stronger rents.
The Big Picture
Two rate cuts stabilized the market, but they didn’t ignite it. The Bank of Canada’s pause means this is as good as it gets on the rate side for now. From here, recovery will depend on income growth, consumer confidence, and housing policy, not cheap credit.
The market is no longer crashing — it’s just stuck. Buyers have leverage, sellers are cautious, and investors are getting smarter. Real estate’s back to being a fundamentals game, not a speculation one.
How We Can Help
And here at Elevate, we’re not just a real estate brokerage — we’re Toronto multiplex investors ourselves. We practice what we preach and use the same strategies we help our clients with: the right opportunities that actually cash flow, not just look good on paper.
We run the numbers, help you buy the best deals, plan the renovations, lease up the units, and manage the property long-term — so you don’t have to figure it out the hard way.
What Toronto Real Estate Investment Is Right For You?
Check out our complete Toronto real estate investment guide for all the details and real-life examples. If you’re ready to dive in, just book a call with us!