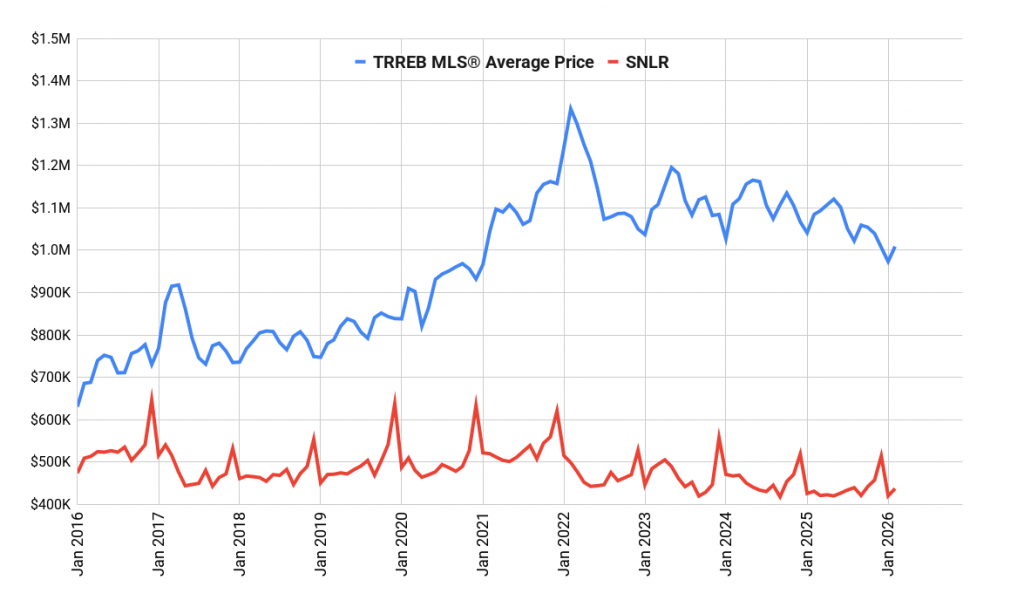
The February 2026 Toronto real estate market continues to show a pattern investors should pay attention to: demand is still present in key segments even while prices remain below last year’s levels.
Total sales were 3,868, and the average price was $1,008,968, which is down 7% year-over-year. At the same time, new listings were 10,705, representing an 11% decline year-over-year.
That combination matters.
Fewer listings compared to last year means supply is tightening, even though prices have not fully recovered. For investors looking at income properties, this type of environment can quietly increase competition for the limited number of properties that actually work as rentals or multi-unit conversions.
But the most interesting signal in the February dataset is not the overall market.
It is where demand held up year-over-year.
Market Overview
| Metric | Feb 2025 | Feb 2026 | Change |
|---|---|---|---|
| Average Price | $1,084,547 | $1,008,968 | -7% |
| Sales | 4,037 | 3,868 | -4% |
| New Listings | 12,066 | 10,705 | -11% |
| SNLR | 33% | 36% | +8% |
416 vs 905 Market Breakdown
The biggest takeaway from the February data is the divergence between core Toronto (416) and the surrounding 905 region.
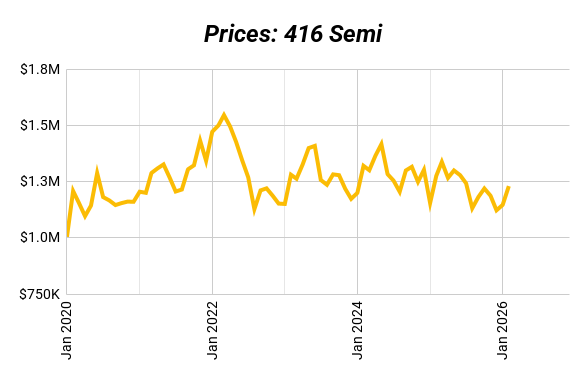
Low-rise properties in the 416 continue to show stronger buyer absorption, particularly in the semi-detached segment.
The 416 Semi-Detached sales-to-new-listings ratio sits at 55%, and the dataset shows a year-over-year improvement in SNLR of +12%. That means buyers are absorbing available inventory more aggressively than they were at the same time last year.
This matters for investors because semi-detached properties are one of the most common starting points for duplex and triplex conversions in Toronto.
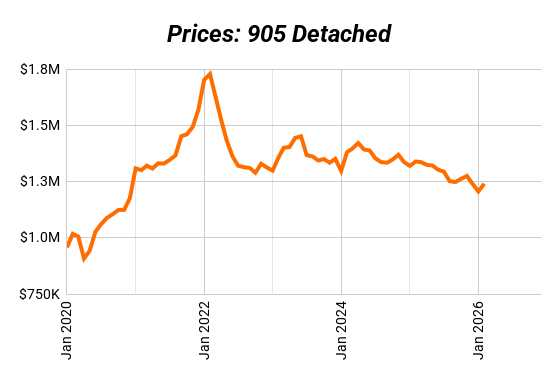
Meanwhile, the 905 condo market remains the weakest segment, with a 28% SNLR and a 10% year-over-year price decline. Demand is still present, but buyers clearly have more negotiating power in that segment.
For investors, this tells a simple story:
Core Toronto low-rise housing still has structural demand, while condos and some suburban segments remain more negotiable.
Detached vs Semi vs Condo Trends
Looking at property types reveals a clear divergence in resilience.
Semi-Detached Homes
The 416 semi-detached segment is the strongest segment in the dataset, with an SNLR of 55% and a 12% year-over-year improvement.
That means demand for these homes strengthened relative to available inventory compared to last year, even while the broader market remains uncertain.
For investors, this is not surprising.
Semis often offer the best balance of entry price and multi-unit conversion potential, which keeps investor demand relatively stable even in slower markets.
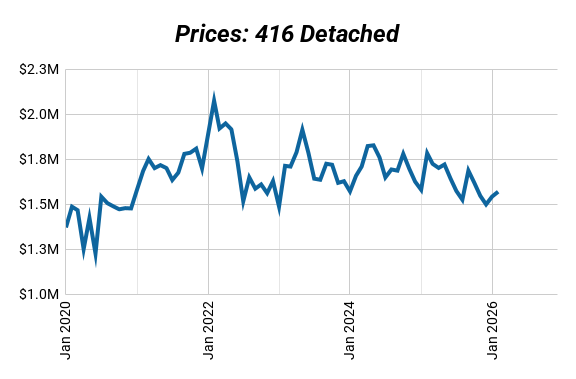
Detached Homes
Detached homes remain active, but prices are still adjusting. The 416 detached average price is $1,568,543, which is down 12% year-over-year.
However, demand is still absorbing supply at a healthy pace, with a 40% SNLR.
Many detached homes are also the foundation for duplex, triplex, and fourplex conversions, which explains why demand in this segment tends to hold up better than condos.
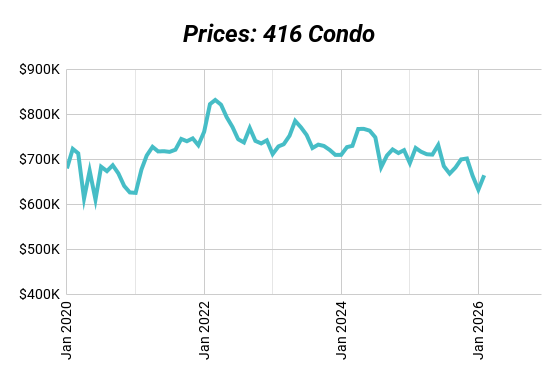
Condo Apartments
Condos remain the weakest segment of the Toronto market.
The 416 condo SNLR is 33%, while 905 condos sit at 28%, and prices are still down year-over-year.
This is why investors focused purely on appreciation often gravitate toward condos, while investors focused on income and long-term housing supply constraints tend to prefer low-rise properties.
Hidden Market Signal: Low-Rise Demand Resilience
One signal that is easy to miss in the February data is the resilience of low-rise housing demand in the 416.
Even while the broader market is still adjusting to higher interest rates, the 416 semi-detached segment improved its absorption rate year-over-year.
That means buyers did not disappear.
They simply became more selective and focused on properties with long-term value, such as homes that can generate rental income or support multi-unit conversions.
For multiplex investors, this reinforces a key reality about Toronto housing.
The city still faces long-term supply constraints, and properties that can house multiple tenants continue to attract real demand.
| Segment | Feb 2026 SNLR | SNLR Change |
|---|---|---|
| 416 Detached | 40% | +18% YoY |
| 416 Semi | 55% | +12% YoY |
| 416 Condo | 33% | +5% YoY |
| 905 Detached | 35% | +4% YoY |
What is SNLR (Sales-to-New-Listings Ratio) and Why It Matters
| Segment | Feb 2026 SNLR | Historical SNLR | Sales | Listings |
|---|---|---|---|---|
| 416 Detached | 40% | 55% | 437 | 1,093 |
| 416 Semi | 55% | 67% | 150 | 272 |
| 416 Condo | 33% | 51% | 733 | 2,246 |
| 905 Detached | 35% | 55% | 1,246 | 3,539 |
The Sales-to-New-Listings Ratio (SNLR) shows how hot or cold the market is by measuring how many homes are selling compared to how many are being listed.
- Seller’s Market (SNLR above the dotted line): More buyers than sellers. Homes move fast, competition heats up, and prices usually rise.
- Buyer’s Market (SNLR below the dotted line): More listings than buyers. Homes sit longer, buyers have leverage, and prices tend to soften.
- Balanced Market (SNLR near the dotted line): Supply and demand are in sync. Prices stay relatively stable.
Every market has its own version of that dotted line, but the trend matters most — if SNLR is rising, the market’s tightening. If it’s falling, buyers are gaining ground.
Sales-to-new-listings ratios moved higher in December, but this should be interpreted carefully. With many listings held back during the holidays, SNLR tends to overstate market tightness at year-end. The trend over several months remains more informative than a single December reading.
What Multiplex Investors Should Watch Next
If you are focused on Toronto duplexes, triplexes, and fourplex opportunities, there are three signals to watch over the next few months.
First, new listings.
The dataset shows an 11% decline in listings year-over-year. If supply remains tight, competition for good multi-unit opportunities could increase.
Second, absorption rates in low-rise housing.
Segments like 416 semis already show strong demand relative to supply, and that trend often appears before prices fully stabilize.
Third, investor competition shifting away from condos.
If condo demand stays weak, more investors may redirect capital toward cash-flowing rental properties, which could increase competition for multiplex-style assets.
Final Takeaway
The February 2026 data shows a market that is not booming but also not collapsing.
Prices remain below last year’s levels, but supply is tightening and certain segments are proving resilient.
For investors focused on income properties and multiplex conversions, the key takeaway is simple:
Demand for low-rise housing in core Toronto continues to hold up, even in a slower market environment.
If you’re looking at a Toronto investment property and want a second set of eyes on the numbers, send us the deal and we’ll take a look.
Want to see what’s possible for you? Book a strategy session with us here.
