The March numbers look relatively stable. Sales turned positive again after two consecutive months of declines. Listings came in unusually low for this time of year. Prices are sitting at multi-year lows across every property type. On the surface it looks like the market is finding a floor.
But underneath that stability, there are two forward-looking risks that are not showing up in the data yet. The first is a condo supply wave that has not landed yet. The second is broader economic and trade uncertainty that is starting to affect buyer confidence. Neither shows up cleanly in March’s numbers. Both matter more than the March data itself.
Market Overview
| Metric | Mar 2025 | Mar 2026 | Change |
|---|---|---|---|
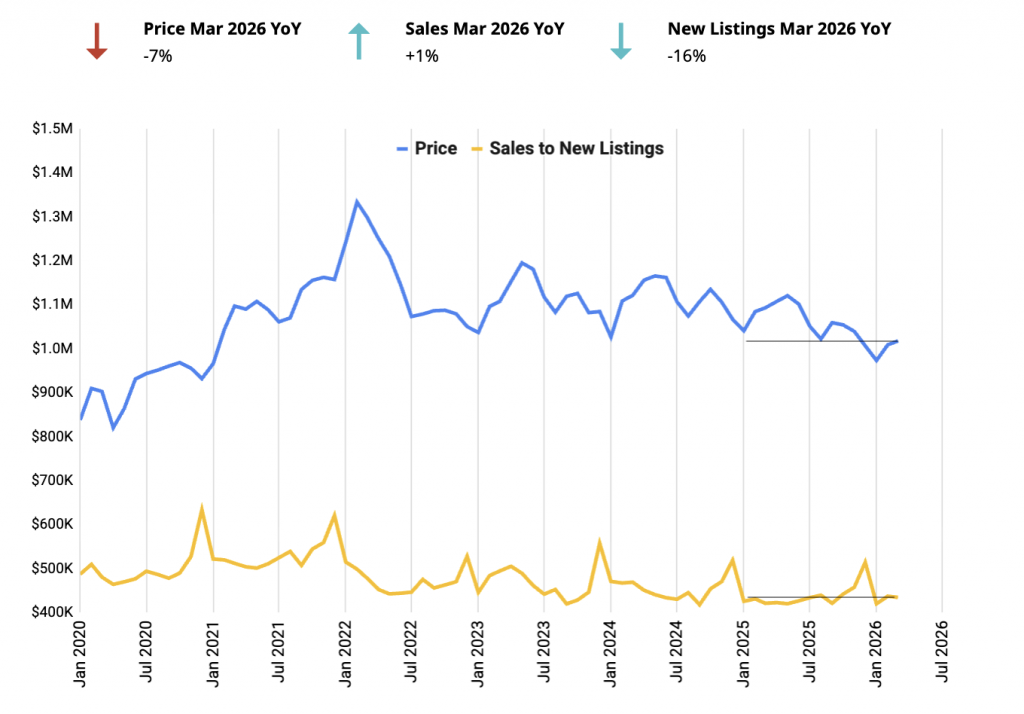
| Average Price | $1,093,254 | $1,017,796 | -7% |
| Sales | 5,011 | 5,039 | +1% |
| New Listings | 17,263 | 14,442 | -16% |
| SNLR | 29% | 35% | +20% |
What is SNLR (Sales to New Listings Ratio) and Why It Matters
| Segment | Mar 2026 SNLR | Historical SNLR | Sales | Listings |
|---|---|---|---|---|
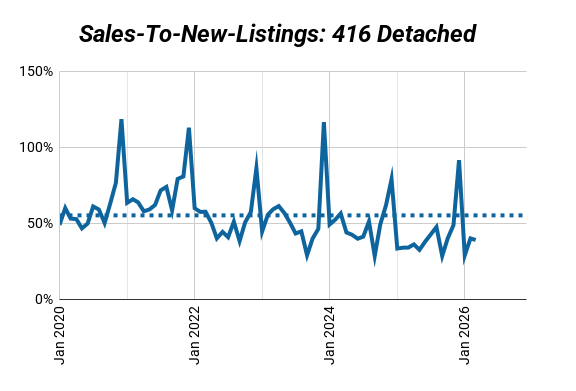
| 416 Detached | 39% | 55% | 574 | 1,474 |
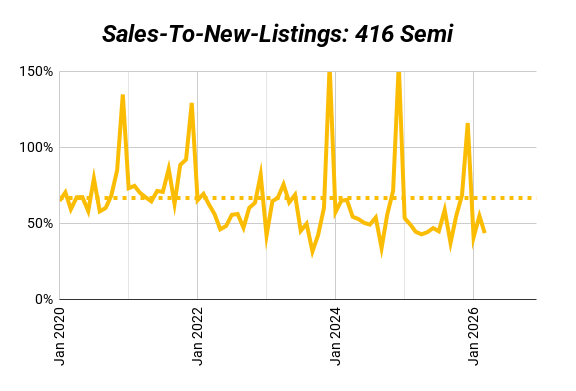
| 416 Semi | 44% | 67% | 170 | 388 |
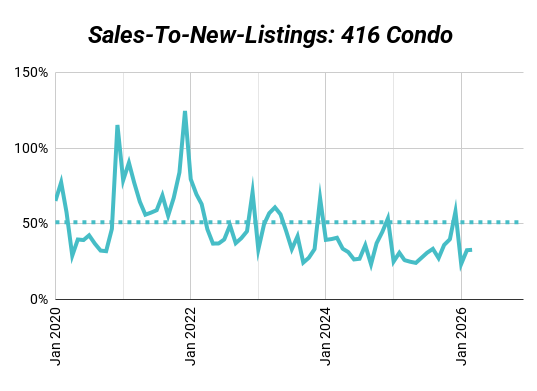
| 416 Condo | 33% | 51% | 951 | 2,890 |
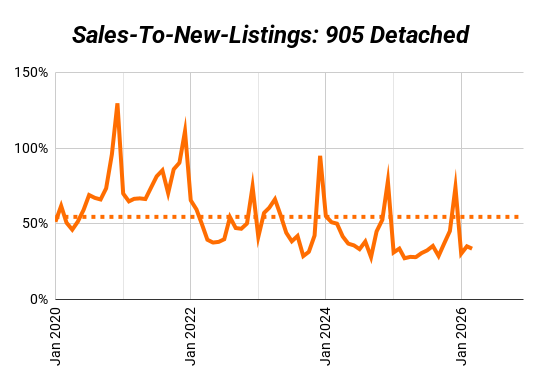
| 905 Detached | 34% | 55% | 1,661 | 4,935 |
The Sales to New Listings Ratio (SNLR) shows how hot or cold the market is by measuring how many homes are selling compared to how many are being listed.
- Seller’s Market (SNLR higher than historical average): More buyers than sellers. Homes move fast, competition heats up, and prices usually rise.
- Buyer’s Market (SNLR below higher than historical average): More listings than buyers. Homes sit longer, buyers have leverage, and prices tend to soften.
- Balanced Market (SNLR near the historical average): Supply and demand are in sync. Prices stay relatively stable.
416 vs. 905: What the Data Shows
The big picture has not changed much. Buyers are still active. Sellers are pulling back. Prices are still falling but the market is not getting worse. It is slowly finding a bottom.
March is usually one of the busiest months for new listings. That is not what we are seeing. Sellers are staying on the sidelines, which is keeping the market more balanced than the price numbers suggest.
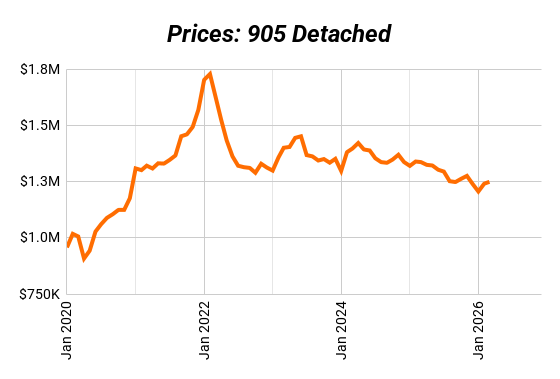
The 416 and 905 low-rise markets are both improving but in different ways. The 416 has been soft longer and is now stabilising. The 905 took longer to slow down but is bouncing back faster, with stronger sales growth year-over-year right now.
| Segment | Mar 2025 Sales | Mar 2026 Sales | Change |
|---|---|---|---|
| 416 Detached | 572 | 574 | 0% |
| 416 Semi | 207 | 170 | -18% |
| 416 Condo | 925 | 951 | +3% |
| 905 Detached | 1,583 | 1,661 | +5% |
| Segment | Mar 2025 New Listings | Mar 2026 New Listings | Change |
|---|---|---|---|
| 416 Detached | 1,688 | 1,474 | -13% |
| 416 Semi | 466 | 388 | -17% |
| 416 Condo | 3,557 | 2,890 | -19% |
| 905 Detached | 5,793 | 4,935 | -15% |
| Segment | Mar 2025 Price | Mar 2026 Price | Change |
|---|---|---|---|
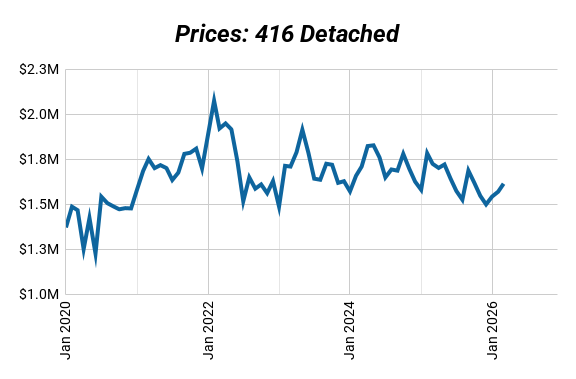
| 416 Detached | $1,723,489 | $1,613,066 | -6% |
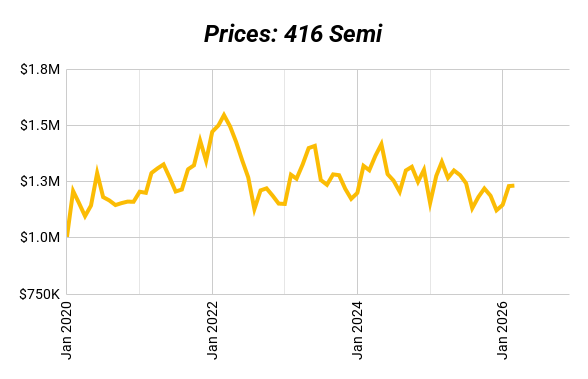
| 416 Semi | $1,337,498 | $1,231,967 | -8% |
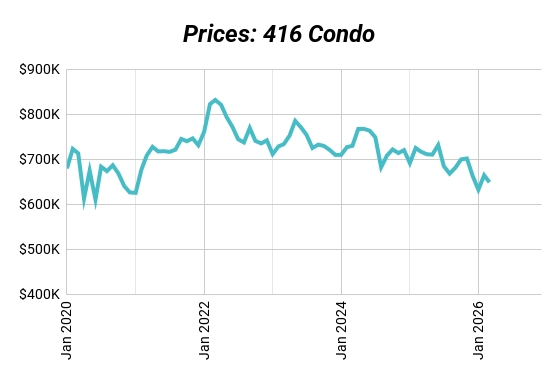
| 416 Condo | $716,460 | $648,287 | -10% |
| 905 Detached | $1,336,568 | $1,248,832 | -7% |
416 Detached, Semi, and Condo: How Each Segment Performed
416 Detached is starting to find its footing. Sales held steady year-over-year and fewer sellers are listing than usual for this time of year. Prices are still down compared to last year, but that is normal. Prices are always the last thing to change. What changes first is how fast homes are selling relative to what is available, and that number is improving. The market is getting tighter before prices show it. For investors looking at larger properties to convert or build on, this is a better time to buy than it has been in years.
416 Semi is in its own category. Semis in the city are still selling fast and above asking price even while everything else is soft. Fewer sellers are listing and buyers are still showing up. That is a tight market no matter what the headlines say. If you are waiting for prices to fall before buying a semi to convert, you may be waiting a long time. The competition is already there.
416 Condo is the most complicated story this month. Fewer listings are hitting the market and more of them are selling. That is usually a sign things are tightening up. And again, prices are still falling, but that is normal. Prices are always the last number to turn.
The catch is what is not showing up in the data yet. A lot of pre-construction units that were bought at peak prices in 2021 and 2022 are finishing construction now. Many of those buyers owe more than the unit is worth today. Some cannot afford to close. Others cannot make the numbers work as a rental. When those units hit the resale market, and some already are, that is extra supply coming in on top of the normal spring listings. The March numbers looked calm. That may not last. The condo market is stabilising but it is fragile, and it is the one to watch closely for the rest of 2026.
Hidden Market Signals
| Year | GTA Condo Completions |
|---|---|
| 2024 | ~29,000 (record high) |
| 2025 | ~29,291 |
| 2026 (projected) | ~22,066 |
| 2027 (projected) | ~14,366 |
Source: Urbanation, 2026
The biggest signal this month is not in the current numbers. It is in what the numbers are not showing yet.
Condo listings looked calm in March. But a lot of new condo buildings bought at peak prices in 2021 and 2022 are finishing construction right now. Many of those buyers are stuck. When they start selling, that is a wave of extra listings hitting the market on top of the normal spring supply. The calm we saw in March may not last.
The other thing worth noticing is what buyers are actually paying. In a market everyone is calling soft, 416 semis are still selling above asking. 416 detached are selling at almost exactly the asking price. Only condos are seeing real discounts. The market is not soft everywhere. It is soft in one spot while everything else is holding up quietly.
| Segment | Average List Price | Average Sale Price | Sale vs List Price |
|---|---|---|---|
| 416 Detached | $1,628,349 | $1,613,066 | 99% |
| 416 Semi | $1,184,584 | $1,231,967 | 104% |
| 416 Condo | $668,336 | $648,287 | 97% |
| 905 Detached | $1,274,318 | $1,248,832 | 98% |
What Multiplex Investors Should Watch
Unlike condos, multiplexes do not have a flood of new supply coming. There is no pre-construction pipeline. Supply is tight and rental demand is strong because most people still cannot afford to buy.
The wildcard right now is the broader economy. Trade uncertainty is real and some buyers who were ready to act may pause again. That could mean more time to find the right deal. It could also put some pressure on rents if jobs are affected. Worth keeping an eye on.
The core case for Toronto multiplexes has not changed. Supply is constrained, rents are holding, and prices are well below their peak. The opportunity is there for investors who are ready to move.
Final Takeaway
March 2026 looks calm. Sales are up. Listings are down. The market is finding its footing. But the next few months will be the real test. Spring listings are coming. The condo supply wave is coming. And the broader economy is adding uncertainty that was not there three months ago.
For multiplex investors, the entry point is still there. Prices are well below peak, supply is tight, and rental demand is solid. Just go in with your eyes open.
If you’re looking at a Toronto investment property and want a second set of eyes on the numbers, send us the deal and we’ll take a look.
Want to see what’s possible for you? Book a strategy session with us here.
