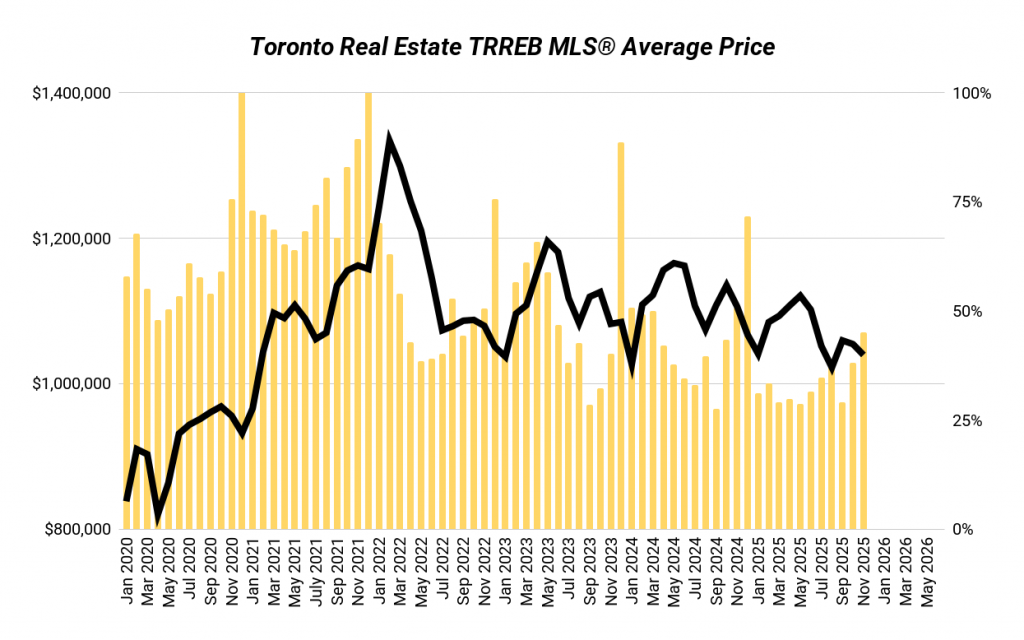
Toronto’s real estate market slipped again in November. Prices fell, sales dropped, and even with lower new listings, the market didn’t tighten in any meaningful way. Two rate cuts helped buyers qualify, but they didn’t restore confidence — and that’s the real problem.
We’re still in the same phase: past the crash, but nowhere near a recovery. And now, new policy risks — like Olivia Chow’s proposed higher LTT for $3M+ homes — are adding more pressure to the upper end of the market.
The headline? Condos are weakening, 905 is unwinding harder, and only semis are holding their ground.
Market Overview
| Metric | Nov 2024 | Nov 2025 | YoY |
|---|---|---|---|
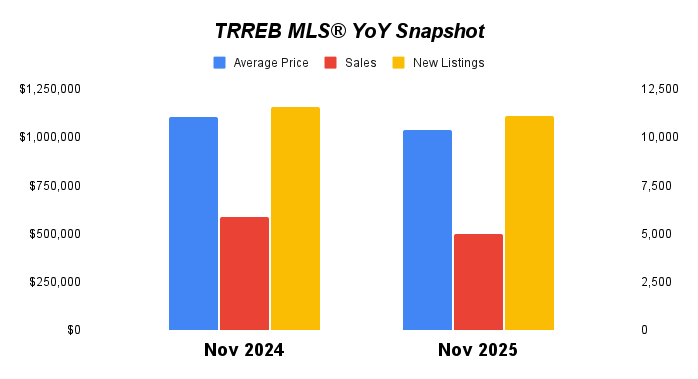
| Average Price | $1,106,050 | $1,039,458 | -6% |
| Sales | 5,875 | 5,010 | -15% |
| New Listings | 11,592 | 11,134 | -4% |
| SNLR | 51% | 45% | -11% |
Even with fewer listings hitting the market in November, the drop in sales was bigger. That’s not tightening. That’s a market waiting — buyers waiting for better value, and sellers waiting for better prices.
The Real Story Behind the Numbers
This slowdown isn’t about rates anymore. Two cuts didn’t move the needle because prices and carrying costs are still too high relative to incomes. Qualifying got easier, but buying didn’t feel easier.
Confidence is the problem. Sellers still anchor to old peaks. Buyers refuse to stretch. That gap is widening — especially in condos and the suburbs.
| Segment | Nov 2024 Price | Nov 2025 Price | YoY |
|---|---|---|---|
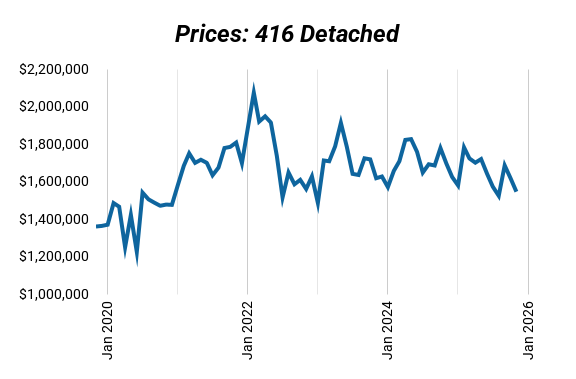
| 416 Detached | $1,695,939 | $1,545,941 | -9% |
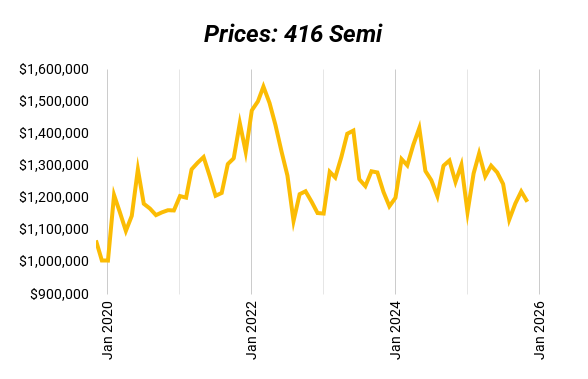
| 416 Semi | $1,248,930 | $1,187,111 | -5% |
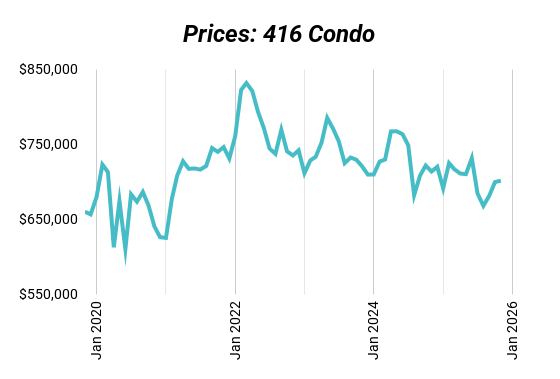
| 416 Condo | $713,364 | $701,259 | -2% |
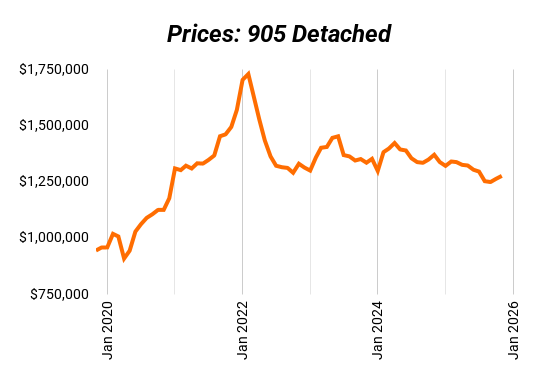
| 905 Detached | $1,369,132 | $1,275,289 | -7% |
416 Detached: Slow, Selective, Still Sideways
Detached homes in the core continue their slow slide. End-users drive this segment, and many are simply not in a rush to buy or sell. Motivated sellers cut; everyone else stays put. That’s why the chart looks choppy but basically sideways since 2022.
New policy risk matters here too. Higher LTT for $3M+ homes shrinks the move-up buyer pool, which indirectly softens the entire detached ladder — even below $3M.
There’s no panic, just very low conviction.
416 Semis: The Most Stable Segment in Toronto
Semis keep holding their ground. They’re the “right sized” home for most families and small investors — good neighbourhoods, manageable price points, and limited supply.
A 69% SNLR says demand is still real here. This is the only segment where supply/demand isn’t broken.
416 Condos: Structurally Weak and Getting Weaker
Condos are the clear weak spot.
- SNLR at 40% — way below historical norms
- Too much supply, especially investor units
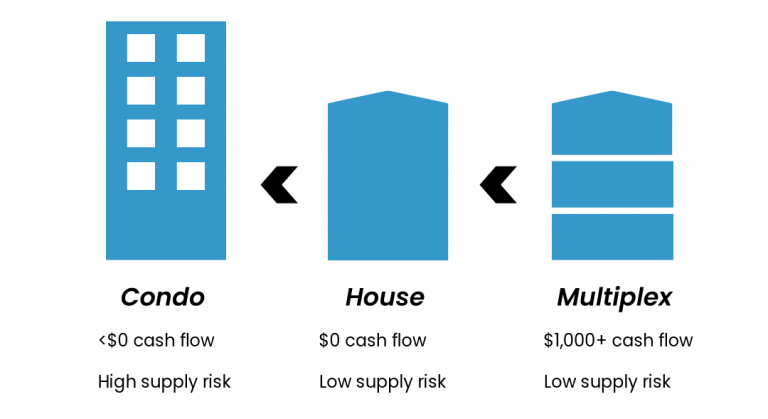
- Negative cash flow for most purchases
- Rising fees + renewal pressure
- Assignment stress still filtering through
- Buyers are extremely selective
416 condo prices have been in a clean downward trend since 2022, not sideways like freeholds. Flat MoM just means fewer sellers listed — not that demand improved. We haven’t found the floor yet.
905 Detached: The Biggest COVID Unwind
The suburbs took the biggest hit during COVID’s upsize frenzy — and they’re giving the most back now.
905 detached saw the most froth from 2020–2022: buyers fleeing the city, upsizing demand, and investors chasing yield. That run-up wasn’t based on fundamentals, so the correction is sharper.
905 detached is still the riskiest segment. It has more room to fall before hitting true value.
What is SNLR (Sales-to-New-Listings Ratio) and Why It Matters
The Sales-to-New-Listings Ratio (SNLR) shows how hot or cold the market is by measuring how many homes are selling compared to how many are being listed.
- Seller’s Market (SNLR above the dotted line): More buyers than sellers. Homes move fast, competition heats up, and prices usually rise.
- Buyer’s Market (SNLR below the dotted line): More listings than buyers. Homes sit longer, buyers have leverage, and prices tend to soften.
- Balanced Market (SNLR near the dotted line): Supply and demand are in sync. Prices stay relatively stable.
Every market has its own version of that dotted line, but the trend matters most — if SNLR is rising, the market’s tightening. If it’s falling, buyers are gaining ground.
November sits at 45%, which is technically “balanced,” but the trend matters more:
- Well below last year
- Below historical norms
- Driven by lower listings, not stronger demand
This is soft, not stable.
Investor Insights
Serious investors haven’t left — they’ve just changed strategies. The old condo appreciation play is dead for now. Suburban speculative buys are too risky.
The investors doing well today are focused on:
- Multiplex conversions
- Laneway/garden suite builds
- Value-add renovations
- Re-leasing at higher rents
- Structuring properties for long-term income, not short-term flips
The fundamentals now favour 416 semis, small freeholds, and multiplex potential, not condos or big suburban homes. This is a market where numbers beat narratives. You win by improving the asset, not waiting for it to bail you out.
The Big Picture
November confirms what’s been true all year:
- Rate cuts alone won’t restart this market
- Buyers still have leverage
- Sellers are cautious
- Investors need to be hands-on and value-driven
- 416 freeholds are holding sideways
- 905 is still unwinding
- Condos haven’t hit bottom
And now with higher LTT proposals for $3M+ homes and uneven zoning across 416 vs 905, policy is tilting the landscape even more in favour of urban, density-friendly assets.
This isn’t a speculation market anymore. It’s a fundamentals market.
How We Can Help
At Elevate, we don’t just talk about value-add — we do it.
We buy, renovate, build, lease, and manage multiplexes every day, and we use the same data-driven approach for our clients that we use for our own properties.
We run the numbers, help you buy the best deals, plan the renovations, lease up the units, and manage the property long-term — so you don’t have to figure it out the hard way.
Want to see what’s possible for you? Book a strategy session with us here.
