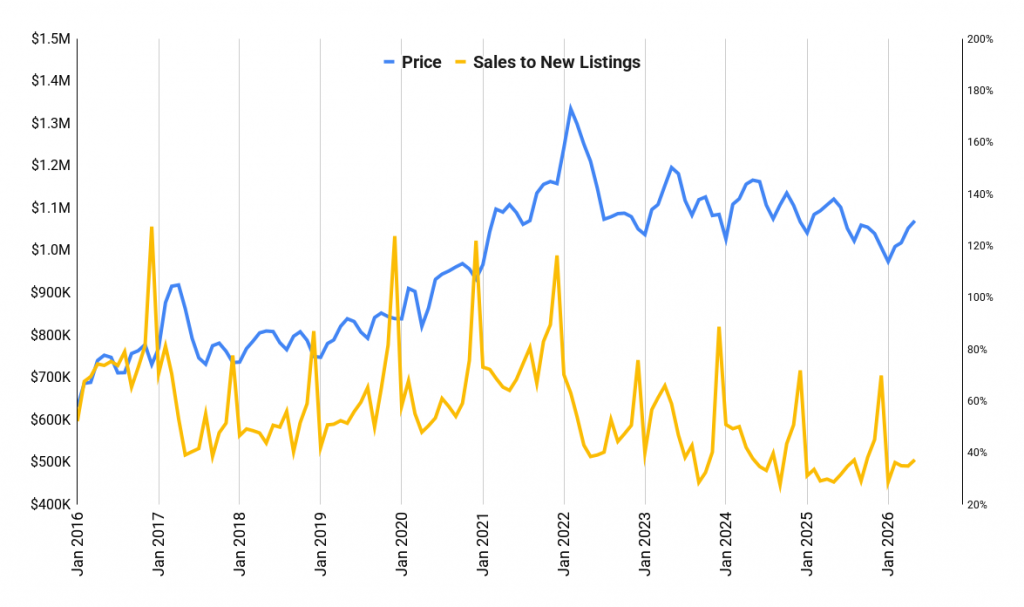
The year-over-year headline for May 2026 says prices are down 4.6%. That number is accurate, but it’s also looking in the wrong direction. Month-over-month, the overall average price has climbed for four straight months — from $1,009,000 in January to $1,070,000 in May. The market isn’t recovering. But it may have found its floor. That’s a different conversation.
The Sales-to-New-Listings Ratio is still 37%, well below the 10-year May average of 55%. Buyer’s market conditions haven’t gone away. But when you combine sideways-to-rising monthly prices with an immigration slowdown that appears to be bottoming out, and temporary worker numbers that are finally flatlining after two years of sharp declines, the setup for Toronto income property starts to look more interesting than the year-over-year numbers suggest.
Toronto Real Estate Market Overview — May 2026
Year-over-year, the market is still soft. Prices are down 4.6%, new listings dropped nearly 19%, and the overall SNLR sits at 37% against a 10-year May average of 55%. On that basis alone, you’d call this a buyer’s market and move on. But the monthly price trend tells a more nuanced story. January 2026 was the low point at $1,009,000. Prices have edged up every month since. That’s not a recovery — but it does look like a base forming at the bottom of the range.
| Metric | May 2025 | May 2026 | Change |
|---|---|---|---|
| Average Price | $1,120,716 | $1,069,700 | -4.6% |
| Sales | 6,195 | 6,583 | +6.3% |
| New Listings | 21,830 | 17,698 | -18.9% |
| Active Listings | 31,047 | 26,927 | -13.3% |
| Avg. Days on Market (LDOM) | 25 | 27 | +8.0% |
| Avg. Total Market Days (PDOM) | 39 | 42 | +7.7% |
| Overall SNLR | ~43% | 37% | Buyer’s Market |
What makes the current data interesting is the gap between the SNLR signal and the price signal. An SNLR of 37% held for two-plus years would normally produce much steeper price declines. Toronto’s overall average is down roughly 20% from the February 2022 peak of $1,334,045 — painful, but not the kind of 30–40% correction you’d historically expect from a market this imbalanced for this long. The floor has been stickier than the demand data would predict.
The monthly price trend reinforces that. The overall average bottomed in January 2026 at $1,009,000 and has risen each month through May. That’s four consecutive months of price gains while the SNLR remains in buyer’s market territory. It suggests sellers and buyers are finding a level. Whether that level holds depends heavily on what happens with rates, rental demand, and the supply of listings through the summer.
What Is SNLR and Why It Matters for Toronto Buyers
The Sales-to-New-Listings Ratio measures how many of the newly listed homes actually sold in a given month. It’s one of the most reliable early indicators of where prices are heading because it moves before prices do. Think of it like a store. If 100 items come in and 70 sell, inventory runs low and prices go up. If only 37 sell, stuff piles up and prices stay under pressure. The overall Toronto SNLR has been below 45% since early 2022. That’s over three years of buyers having the upper hand.
| SNLR Range | Market Type | What It Means for Prices |
|---|---|---|
| Above 65% | Seller’s Market | Prices rise. Multiple offers common. |
| 45% – 65% | Balanced Market | Prices roughly stable. Negotiation on both sides. |
| Below 45% | Buyer’s Market | Prices under pressure. Buyers have leverage. |
What the SNLR also tells you is how much room prices have to move when conditions shift. Toronto’s 10-year May average SNLR is 55%. We’re currently at 37%. If the market normalizes back toward that historical average — not even to a seller’s market, just to balanced — the price pressure that’s been grinding values down for three years goes away. And prices that have been holding at a floor have a long way to bounce back toward where they were.
| Segment | May 2026 SNLR | 10-Year May Average | Market Type |
|---|---|---|---|
| 416 Detached | 40% | 55% | Buyer’s Market |
| 416 Semi-Detached | 55% | 67% | Balanced |
| 416 Condo Apt | 33% | 51% | Buyer’s Market |
| 905 Detached | 37% | 55% | Buyer’s Market |
| 905 Semi-Detached | 42% | 66% | Buyer’s Market |
| 905 Condo Apt | 31% | 55% | Buyer’s Market |
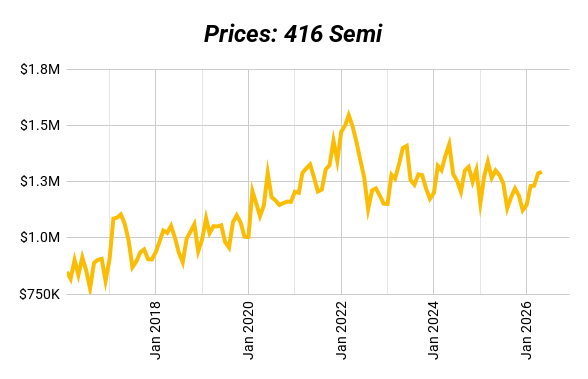
The 416 Semi-Detached is the one segment already at balanced territory with an SNLR of 55%. That’s not a coincidence. It’s the most constrained segment in the city in terms of supply, and the one most often targeted for duplex and triplex conversions. It’s telling you something about where freehold demand is holding up.
416 vs. 905 Detached — The Price Drop in Context
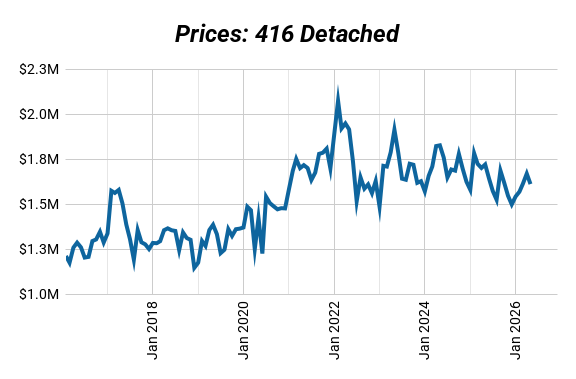
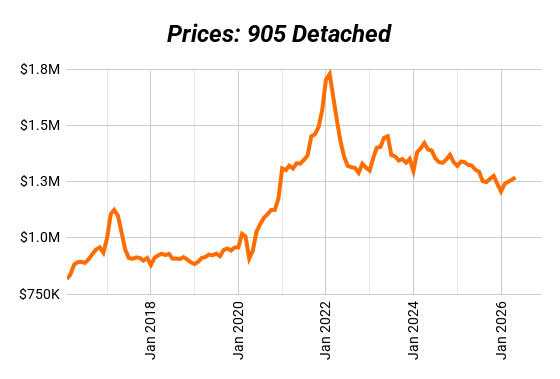
Both the 416 and 905 detached markets saw sales rise roughly 9% year-over-year. Prices fell about 6% in both areas. The important thing to understand is what that 6% drop is measured against — a May 2025 that was itself already well below the 2022 peak. The 416 Detached peaked at $2,074,000 in February 2022. It sits at $1,611,000 today. That’s a $463,000 decline from peak, or roughly 22%. For an investor buying to convert or add a suite, that cost basis shift is significant.
| Metric | 416 Detached | 905 Detached |
|---|---|---|
| Average Price | $1,610,988 | $1,268,625 |
| Price Change (YoY) | -6.7% | -6.1% |
| Price Change (MoM) | +3% | n/a |
| Sales | 846 | 2,390 |
| Sales Change (YoY) | +8.9% | +9.0% |
| New Listings | 2,092 | 6,491 |
| New Listings Change (YoY) | -13.2% | -17.9% |
| SNLR | 40% | 37% |
The 416 Detached MoM price was up 3% in May. That’s one month — not a trend on its own — but it fits the broader pattern of prices edging up since January. The renovation cost to add a laneway suite or convert a detached to a legal multiplex hasn’t changed much over the past three years. The purchase price has come down significantly. That combination is what makes the current window worth paying attention to.
The 905 tells a similar story at lower price points. An SNLR of 37% means buyers still have real leverage in negotiations. Historically, the 905 recovers faster than the 416 on a percentage basis when rates ease, because buyers in that range are more rate-sensitive. The multiplex conversion opportunity is deepest inside the city where rental demand is strongest, but the 905 will benefit from the same macro tailwinds when they arrive.
416 City Breakdown — Detached, Semi, and Condo
The three main 416 segments are behaving very differently right now. Semi-detached is at a balanced market. Detached is in buyer’s market territory but showing monthly price gains. Condo is the weakest segment in the city and faces structural headwinds that aren’t going away quickly. Knowing which segment you’re buying into matters a lot for both your entry price and your long-term thesis.
| Metric | 416 Detached | 416 Semi-Detached | 416 Condo Apt |
|---|---|---|---|
| Average Price | $1,610,988 | $1,293,268 | $673,841 |
| Price Change (YoY) | -6.7% | -0.5% | -5.1% |
| Sales | 846 | 283 | 1,009 |
| Sales Change (YoY) | +8.9% | +2.5% | +4.2% |
| New Listings | 2,092 | 513 | 3,032 |
| New Listings Change (YoY) | -13.2% | -17.8% | -24.5% |
| SNLR | 40% | 55% | 33% |
416 Detached: Down 6.7% year-over-year but up 3% month-over-month in May. The SNLR of 40% keeps it in buyer’s market territory, but the monthly trend suggests prices are stabilising. At $1,611,000, you’re entering roughly $463,000 below the 2022 peak. For investors targeting a conversion or ADU addition, the cost basis is the most attractive it has been in years.
416 Semi-Detached: The most resilient segment in the city. Prices are essentially flat year-over-year at -0.5%, and the SNLR of 55% puts it squarely in balanced market conditions. New listings dropped nearly 18%, which is keeping supply tight and supporting values. A legal duplex or triplex semi in a strong neighbourhood holds value better than any other segment on this list right now and is the most compatible with a multiplex conversion.
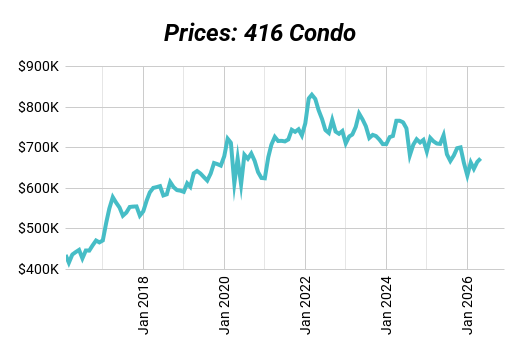
416 Condo Apt: The weakest segment with an SNLR of 33% and prices down 5.1% year-over-year. The headline numbers don’t capture the full picture — thousands of units pre-sold in 2019–2021 at peak prices are completing now. Many investor-owners are facing negative cash flow on day one and listing immediately. That’s a slow drip of supply pressure that will continue through 2026. Unless you’re buying a purpose-built rental at a genuine discount with strong cash flow from day one, the numbers are difficult to make work. Stick to freehold.
What Toronto Multiplex Investors Should Watch Right Now
The case for Toronto freehold right now isn’t that the market is about to surge. It’s that prices have held a floor under conditions that would normally push them much lower, and the factors that drove demand down — high rates, a spike in rental supply, and a sharp drop in immigration — are all in the process of reversing. None of that has fully shown up in the data yet. But the direction of travel matters, especially when you’re buying an asset you plan to hold for a decade.
On immigration, the slowdown in permanent residents and temporary workers that pressured rental demand through 2024 and early 2025 appears to be stabilising. Temporary worker numbers have flattened after a steep decline. That matters directly for multiplex investors because rental demand in Toronto’s end-user neighbourhoods is closely tied to population inflows. A floor on those numbers means a floor on the rental demand headwind. It doesn’t mean rents spike tomorrow, but it does mean the softening pressure eases. A property that cash flows at today’s rents and today’s rates is worth a hard look. Use our total return calculator to stress-test the numbers.
The asymmetry here is worth thinking about clearly. You’re buying at prices that are 20–22% below the 2022 peak in a city where the SNLR has historically averaged 55% in May. If conditions normalise to even a balanced market — not a seller’s frenzy, just balanced — the price pressure that has been grinding values lower for three years disappears. Prices that have been holding at a floor have significant room to move back toward where they were. The downside from here, given how long the correction has already run, looks much smaller than the upside if conditions normalise.
The semi-detached remains the most attractive entry for multiplex investors right now. It’s the only 416 segment near balanced market conditions. It has the tightest supply. And it’s the segment most naturally suited to a legal duplex or triplex conversion. If you’re looking at a detached, the monthly price trend is encouraging — but verify the specific neighbourhood. In well-located pockets of the east and west end, rents have stabilised and properties are moving. That’s where the best risk-adjusted setups are.
| Year | New Permanent Residents | Temp Residents (Net Change) | Total Population Change |
|---|---|---|---|
| 2022 | 437,000 | +490,000 | +703,000 |
| 2023 | 472,000 | +805,000 | +1,272,000 |
| 2024 | 395,000 | +290,000 | +744,000 |
| 2025 | 395,000 | -475,000 | -102,000 |
| 2026 (proj.) | 380,000 | -350,000 | ~+30,000 |
| 2027 (proj.) | 380,000 | -200,000 | ~+180,000 |
| 2028 (proj.) | 380,000 | Stabilising | ~+380,000 |
| 2029 (proj.) | 380,000+ | Modest growth | ~+400,000+ |
Thinking About a Toronto Investment Property? Let’s Look at the Numbers Together.
The May 2026 data shows a market that is still technically in buyer’s territory but behaving differently than the year-over-year numbers suggest. Prices have risen four months in a row from a January low. The immigration floor is forming. Rental demand headwinds are easing. And the gap between where prices sit today and where they’ve historically traded in a normal market is as wide as it’s been in years. That’s not a guarantee of anything — but it does change the risk calculation for someone buying income property with a long hold in mind.
The investors who do well at turning points aren’t the ones who wait for confirmation in the headlines. By the time the market looks obviously good, the entry price is already gone. If you’re evaluating a Toronto multiplex right now and want a second set of eyes on the deal, that’s exactly what we do.
Our brokerage specializes in Toronto multiplexes. We’ll help you find deals, crunch the numbers, and guide you through renovations and management. If you want full support in Toronto multiplex investing, our team can help you:- Find high-potential properties
- Crunch the numbers so you know exactly where you stand
- Coach you through renovations to maximize returns
- Lock in great tenants
- Provide full property management so your investment runs smoothly
