June sales climbed 8% compared to last year and 3% compared to May, but do not read too much into the headline numbers. June is the start of summer, and that is always the start of the slow season for real estate. Fewer people are house hunting, and that is showing up as fewer new listings and fewer deals closing, not as weaker demand.
What is genuinely different this year is the backdrop. Oil is down, inflation risk is down, and bond yields have been sliding, which is pulling fixed mortgage rates lower and improving variable rate discounts. Rents across the city are looking steadier too. Put those together and the fundamentals underneath this market are firmer than the quiet summer numbers suggest.
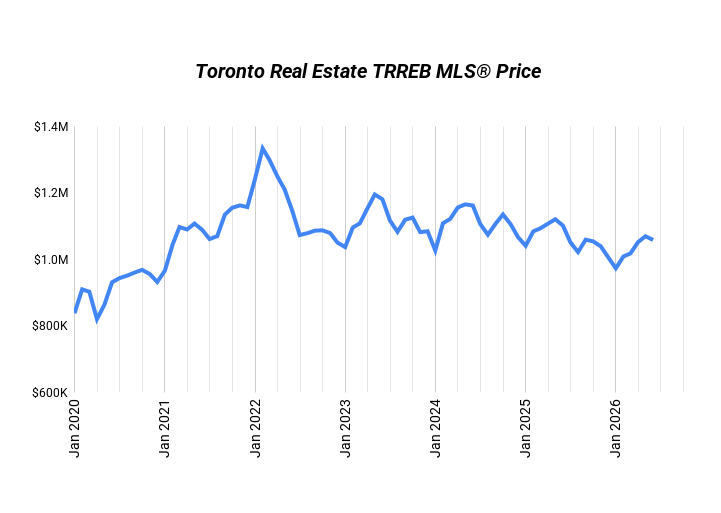
Market Overview
| Metric | Jun 2025 | Jun 2026 | Change |
|---|---|---|---|
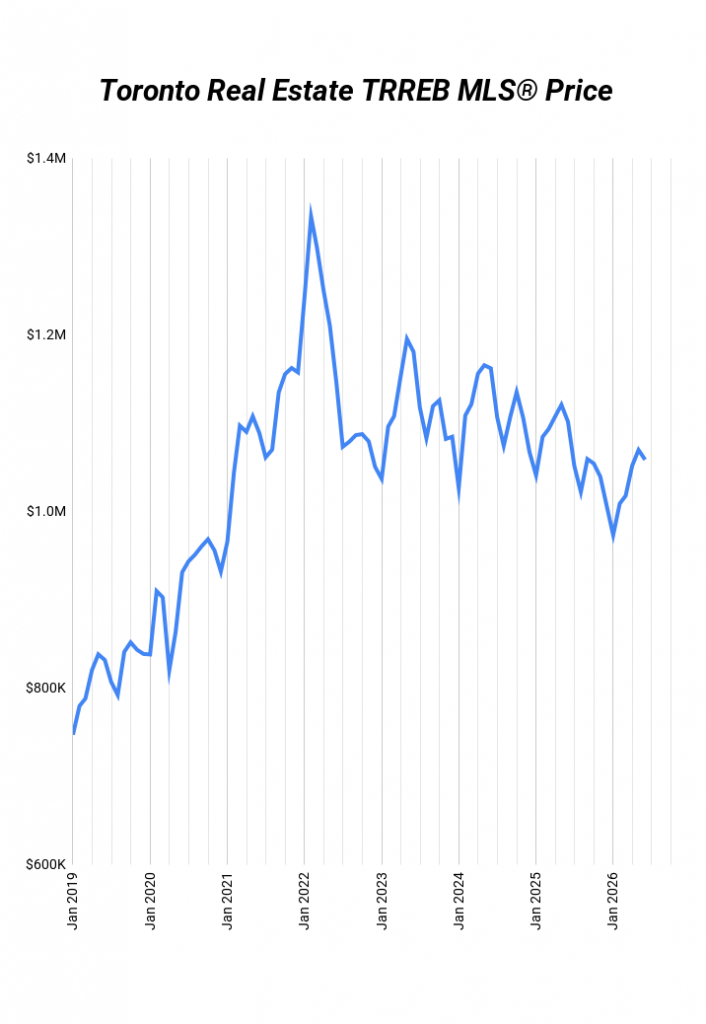
| Price | $1,101,854 | $1,058,658 | -4% |
| Sales | 6,243 | 6,770 | +8% |
| New Listings | 19,839 | 17,282 | -13% |
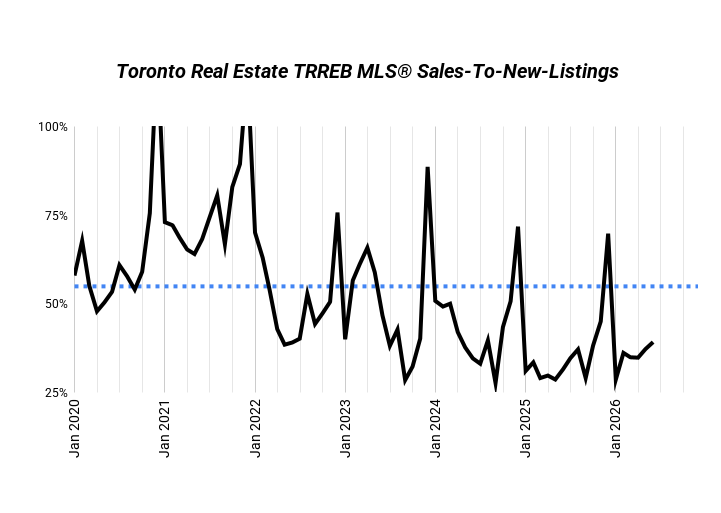
| SNLR | 31% | 39% | +24% |
What Is SNLR and Why It Matters
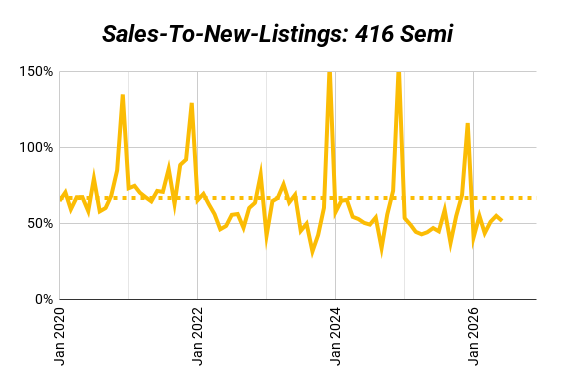
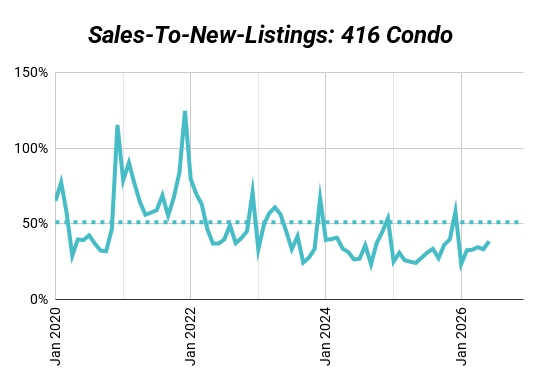
SNLR stands for sales to new listings ratio. Take the homes that sold and divide by the homes that came up for sale. It tells you how fast homes are selling compared to how many are showing up.
A high SNLR means buyers are competing for a small pile of homes. That is a seller’s market, and prices tend to climb. A low SNLR means sellers are competing for a small pile of buyers. That is a buyer’s market, and prices tend to sit flat or fall. In between sits a balanced market, where neither side has the edge.
Seller’s market: SNLR above 60%. Balanced market: SNLR between 40% and 60%. Buyer’s market: SNLR below 40%.
| Segment | Jun 2026 SNLR | YoY | Market Type |
|---|---|---|---|
| 416 Detached | 40% | +5% | Buyer’s market |
| 416 Semi | 52% | +10% | Balanced market |
| 416 Condo | 39% | +39% | Buyer’s market |
| 905 Detached | 38% | +24% | Buyer’s market |
| 905 Semi | 50% | +46% | Balanced market |
| 905 Condo | 36% | +33% | Buyer’s market |
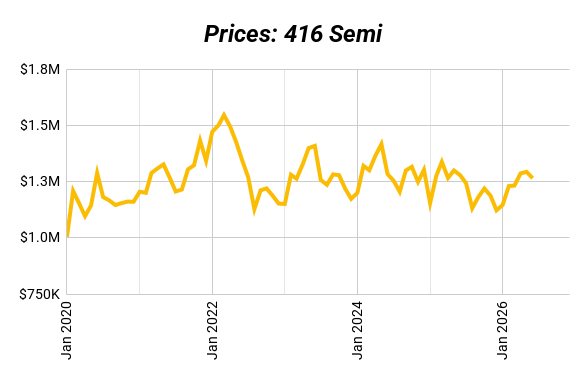
Every segment is up from a year ago, but semi-detached in both regions is closest to balanced. That lines up with semis being the easiest home type to convert into a duplex or triplex. Detached and condo are still firmly in buyer’s market territory, more negotiating room than a typical summer offers.
416 vs 905 Detached: The Big Picture
| Metric | 416 Detached (YoY, MoM) | 905 Detached (YoY, MoM) |
|---|---|---|
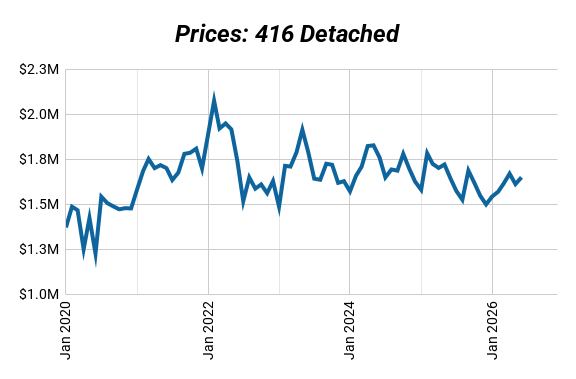
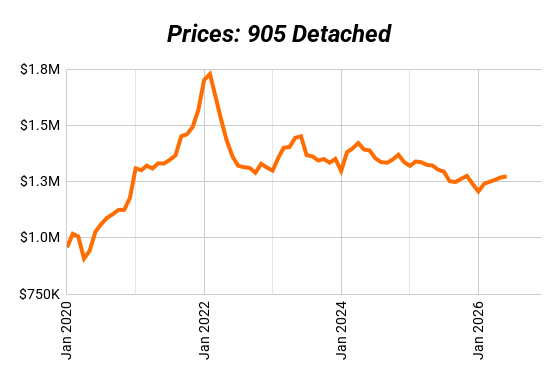
| Price | $1,648,440 (+0%, +2%) | $1,272,842 (-2%, 0%) |
| Sales | 792 (+0%, -6%) | 2,464 (+11%, +3%) |
| New Listings | 1,986 (-5%, -5%) | 6,484 (-10%, 0%) |
| Sales to Listings | 40% (+5%, -1%) | 38% (+24%, +3%) |
Green means the number moved in the direction that favours sellers or momentum (price up, sales up, listings down, sales to listings up). Red is the opposite. Grey means flat, no real move either way.
The two tell different stories. 416 detached is the steadier of the two. Price is flat year over year, because it never corrected as hard in the first place, and sales have held roughly even. 905 detached is the one actually showing more upward momentum right now: sales are up 11% year over year and 3% from last month, and its sales to listings ratio jumped 24% year over year, both bigger moves than the 416 posted.
So this is not 416 recovering faster. It is 416 staying steady because it has less ground to make up, while 905 is doing the actual recovering, climbing off a lower base. For an investor, 416 detached is the lower-risk, more predictable option. 905 detached is where the momentum is, worth watching if you want exposure to a market still finding its footing.
Hidden Market Signals
| Segment | 416 SNLR | All TRREB SNLR | 416 Days on Market |
|---|---|---|---|
| Detached | 98% | 97% | 22 days |
| Semi-Detached | 105% | 102% | 17 days |
| Condo Apt | 97% | 97% | 37 days |
Semi-detached homes in the 416 are selling for 105% of asking, the only segment with real seller leverage, and in the fewest days. That lines up with the SNLR table above. Semis are the closest thing to a balanced, normal market this June.
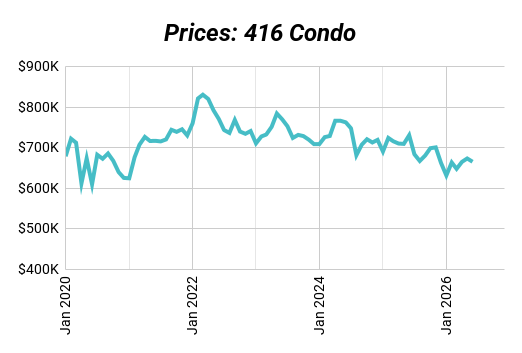
Condos sit at the other end, selling right at asking price and taking the longest of the three. But condo sales are still climbing on both counts, as shown in the SNLR table. Sellers who list are pricing to move, not testing the market, and it is working.
Where Interest Rates Are Headed
The Bank of Canada has held its rate at 2.25% since early 2026, and the big five banks agree it’s staying there through the rest of this year. The split shows up in 2027. TD and BMO expect the rate to stay flat at 2.25%. Scotiabank sees it climbing to 3.00%, CIBC to 2.75%, and RBC to 3.25%.
| Bank | July 2026 | Sep 2026 | Dec 2026 | Dec 2027 |
|---|---|---|---|---|
| TD | 2.25% | 2.25% | 2.25% | 2.25% |
| CIBC | 2.25% | 2.25% | 2.25% | 2.75% |
| BMO | 2.25% | 2.25% | 2.25% | 2.25% |
| RBC | 2.25% | 2.25% | 2.25% | 3.25% |
| Scotiabank | 2.25% | 2.25% | 2.75% | 3.00% |
For multiplex investors, this matters more than the headline sales numbers. If rates hold flat through 2026 and only creep up in 2027, today’s cash flow math has room to breathe before borrowing costs move again. That’s a longer window than most buyers assume to lock in a deal while rents are still catching up and prices are still down from the peak.
Rents: Where They’ve Been, Where They’re Headed
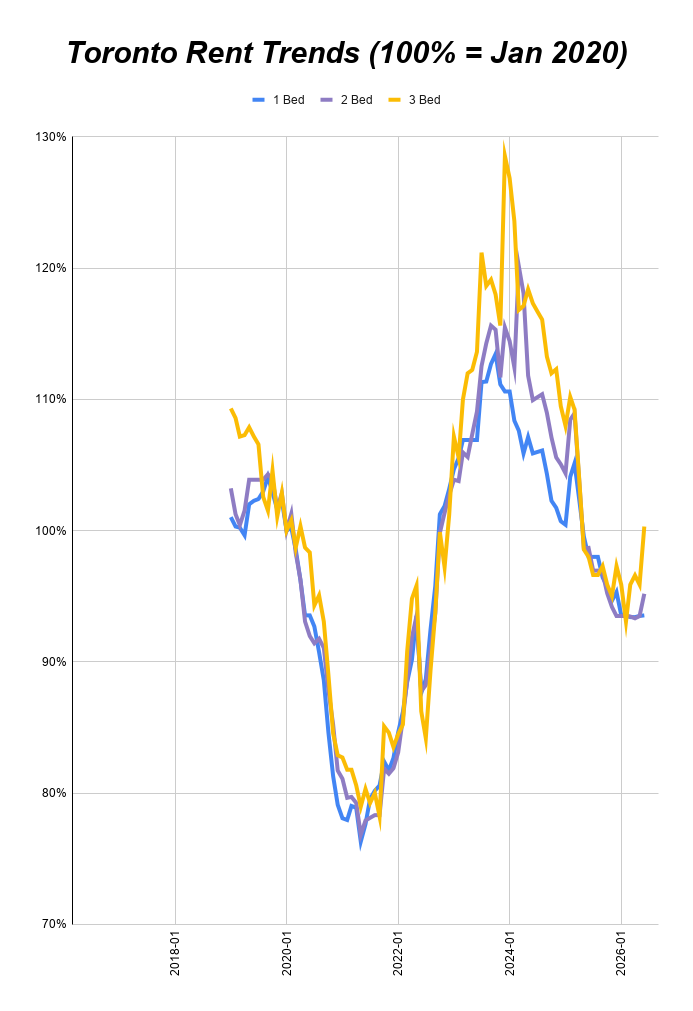
Rents and interest rates tend to move together. When rates started climbing in 2022, rents shot up hard right alongside them. So when you hear that rents are falling now, that is not a drop to some normal baseline. It is a pullback from that much higher peak. Rents today are still settling in above pre-COVID levels, even after that cooling.
That relationship matters for where rents go next. With the Bank of Canada holding at 2.25% through the rest of 2026 and only a possible move upward in 2027, there is no clear signal pointing to rents dropping further in the short term. If rates hold or rise, rents typically follow the same path. We may be close to the bottom of this rent cycle, but it is too early to call that with confidence.
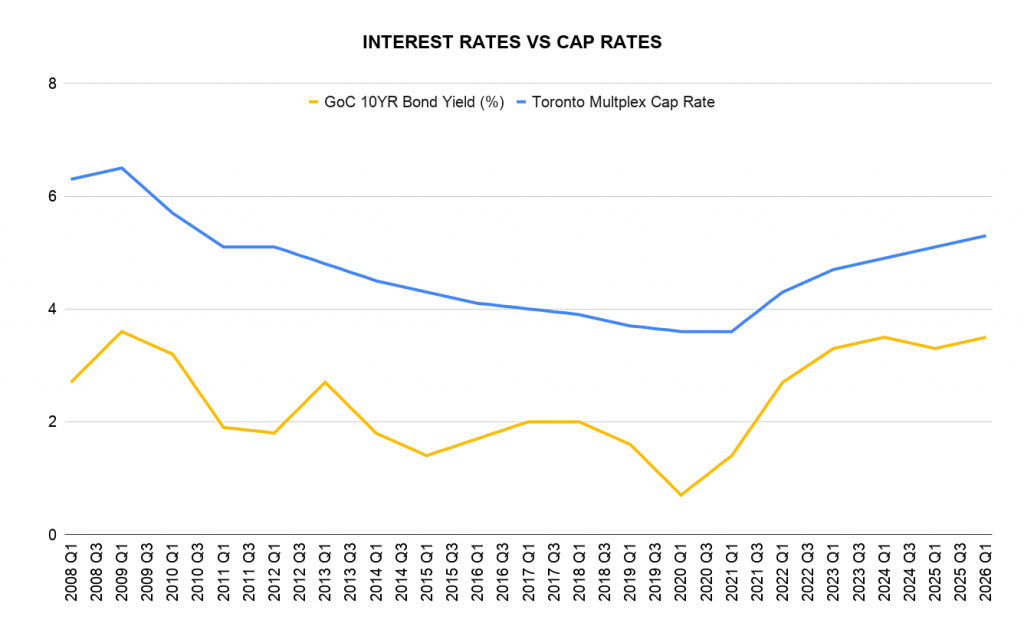
What we do know today is that rents are still higher than they were before COVID, while purchase prices are down around 25% from their peak and well below pre-COVID levels too. That gap between higher rents and lower prices is exactly why cap rates look more attractive right now than they have in years, even with borrowing costs higher than they were back in 2021.
Ready to Make Your Move?
This June looks quiet, and it is, but not for the reason most people assume. Buyers are on summer break, not on the sidelines out of fear. With rates easing and rents holding steady, the setup underneath this market is stronger than the slow headline numbers let on. Spotting a genuinely good deal in a quiet market is exactly where an experienced team earns its keep.
Our brokerage specializes in Toronto multiplexes. We’ll help you find deals, crunch the numbers, and guide you through renovations and management. If you want full support in Toronto multiplex investing, our team can help you:- Find high-potential properties
- Crunch the numbers so you know exactly where you stand
- Coach you through renovations to maximize returns
- Lock in great tenants
- Provide full property management so your investment runs smoothly

