On the surface, July looked like a quiet month. Prices across the Toronto region slipped year over year, and sales dipped slightly too. Nothing dramatic. The kind of number you could glance at and move on.
Underneath that, something bigger is happening. New listings fell sharply compared to last July, the sharpest drop of any number in this report. Buyers have far less to choose from than they did a year ago. At the same time, homes are moving faster relative to what’s coming up for sale. Prices are still catching up to that shift. They almost always do last.
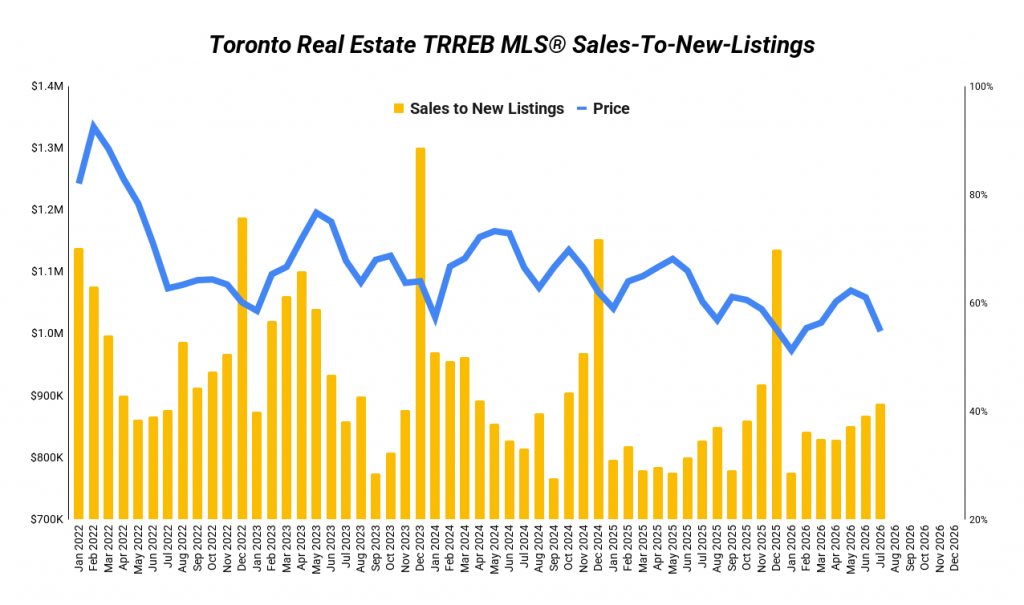
July 2026 Market Overview
| Metric | July 2025 | July 2026 | Change |
|---|---|---|---|
| Average Price | $1,051,719 | $1,003,956 | -5% |
| Sales | 6,100 | 5,995 | -2% |
| New Listings | 17,613 | 14,484 | -18% |
| Sales-to-New-Listings Ratio | 35% | 41% | +6 pts |
What Is SNLR and Why It Matters
SNLR stands for sales-to-new-listings ratio. It’s simple math: how many homes sold, divided by how many new homes came up for sale. It tells you how fast homes are selling compared to the pile of available homes.
Under 40% is a buyer’s market. Homes sit longer and buyers have room to negotiate. Between 40% and 60% is a balanced market, where neither side has the upper hand. Above 60% is a seller’s market, where homes sell fast and bidding wars come back.
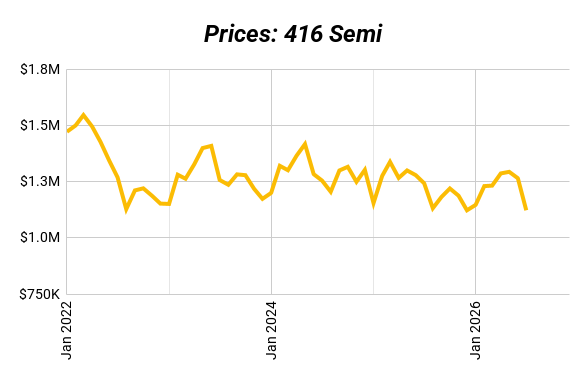
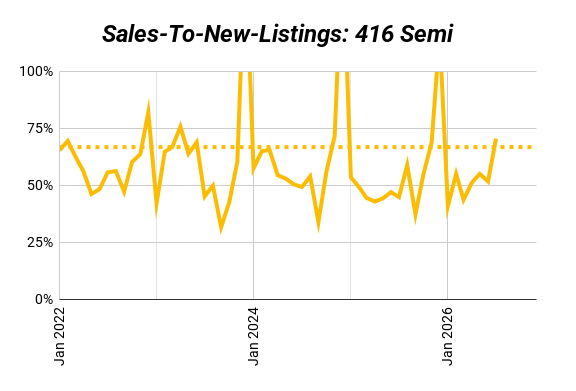
Right now, most of Toronto sits in that balanced zone. One segment stands out. Toronto semis have swung into seller’s market territory, even while the average price for that segment kept falling. That’s the price lag rule in action. Speed changes first. Price takes months to catch up.
| Segment | July 2026 SNLR | Historical Average | Market Type |
|---|---|---|---|
| All TRREB Areas | 41% | 55% | Balanced, leaning buyer |
| 416 Detached | 48% | 55% | Balanced |
| 416 Semi | 71% | 67% | Seller’s market |
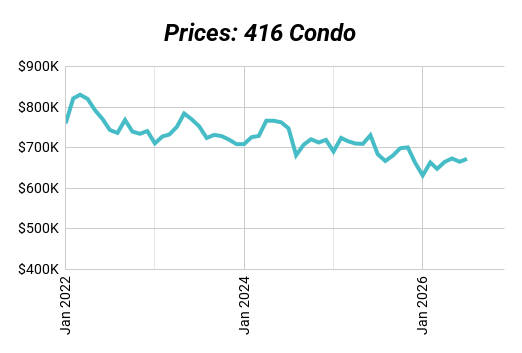
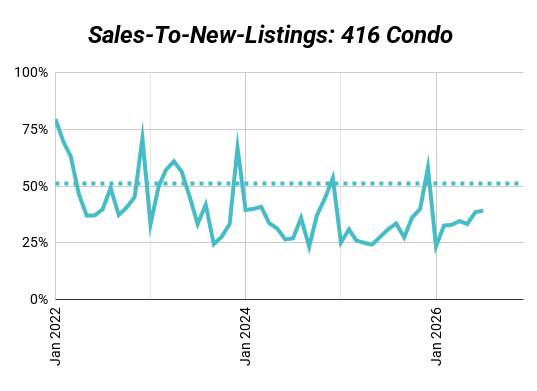
| 416 Condo | 39% | 51% | Buyer’s market |
| 905 Detached | 39% | 55% | Buyer’s market |
416 vs. 905 Detached: The Big Picture
| Detached Sales | July 2025 | July 2026 | Change |
|---|---|---|---|
| 416 (City of Toronto) | 675 | 691 | +2% |
| 905 (Rest of GTA) | 2,120 | 2,098 | -1% |
| Detached New Listings | July 2025 | July 2026 | Change |
|---|---|---|---|
| 416 (City of Toronto) | 1,585 | 1,435 | -9% |
| 905 (Rest of GTA) | 6,521 | 5,423 | -17% |
| Detached Average Price | July 2025 | July 2026 | Change |
|---|---|---|---|
| 416 (City of Toronto) | $1,572,832 | $1,547,928 | -2% |
| 905 (Rest of GTA) | $1,294,424 | $1,207,295 | -7% |
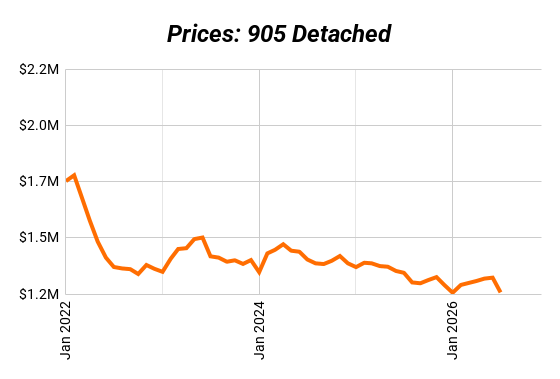
The 416 and 905 aren’t just moving at different speeds, they’re at different distances from balance. City detached homes sit just below their historical average, a tight market that’s close to balanced. That’s why prices there have barely moved.
The 905 tells a different story. Sales-to-listings there sits well below its historical average, far from balanced. That’s exactly why 905 prices are still falling faster. The market has more room to fall before it finds its footing.
New listings explain part of the gap. The 905 lost more of its detached supply year over year than any other detached segment. Even with fewer new listings, that’s still not enough to close the distance to a balanced market the way the 416 has.
City detached prices are now sitting close to where they were back before the pandemic price run-up. The 416 is close to finding its floor. The 905 still has further to go.
For a multiplex investor, this means the 416 is the segment closer to stable ground, while the 905 still has room to soften. Fewer new listings in the city combined with a tighter market means less competition per property, but also less to choose from. Patience and a sharp eye on new listings matter more than ever here.
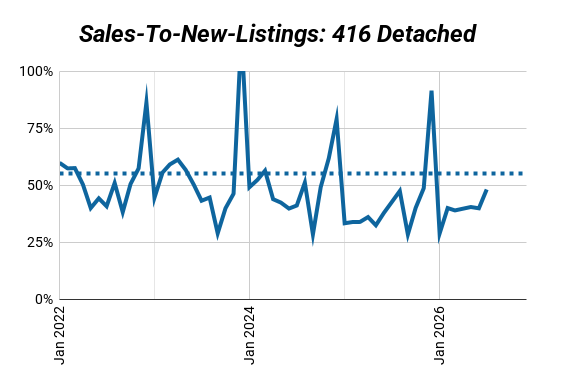
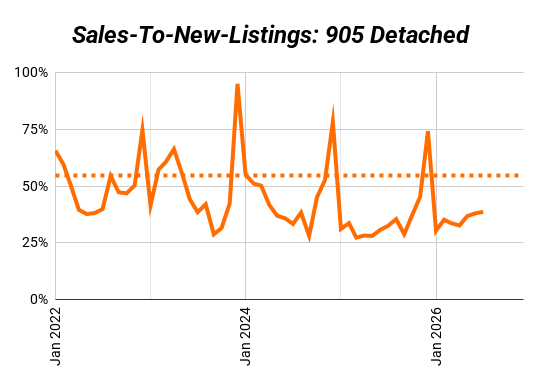
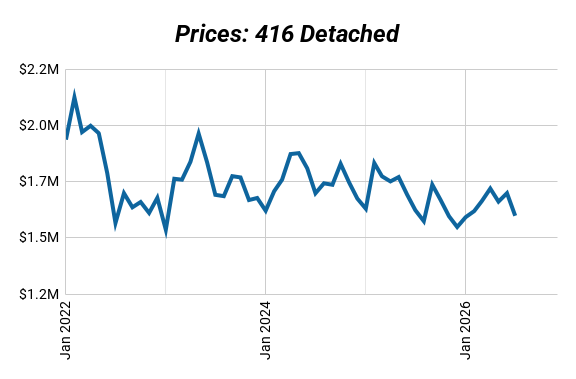
416 City Breakdown: Detached, Semi, Condo
| Sales | July 2025 | July 2026 | Change |
|---|---|---|---|
| Detached | 675 | 691 | +2% |
| Semi | 252 | 233 | -8% |
| Condo | 1,028 | 1,054 | +3% |
| New Listings | July 2025 | July 2026 | Change |
|---|---|---|---|
| Detached | 1,585 | 1,435 | -9% |
| Semi | 560 | 330 | -41% |
| Condo | 3,319 | 2,690 | -19% |
| Average Price | July 2025 | July 2026 | Change |
|---|---|---|---|
| Detached | $1,572,832 | $1,547,928 | -2% |
| Semi | $1,242,388 | $1,122,326 | -10% |
| Condo | $684,257 | $672,807 | -2% |
Detached: The steadiest segment in the city. Sales up, price nearly flat, and prices now sitting close to where they were back before the pandemic run-up. This is the segment that has already found its footing.
Semi-detached: The most confusing segment on paper, and the most telling underneath. Sales fell, but new listings collapsed even faster, more than double the drop in sales. That’s why sales-to-listings jumped into seller’s market territory, even while the average price kept falling. Sellers just haven’t caught up to their own scarcity yet.
Condo: Sales are actually up, the strongest sales growth of the three. But with plenty of new listings still hitting the market and prices still down, the pile of unsold condos remains the drag on this segment. It’s improving, just slowly.
Hidden Market Signals
| Segment (City of Toronto) | Avg. Sale-to-List Price | Avg. Days on Market |
|---|---|---|
| Detached | 97% | 29 |
| Semi-Detached | 101% | 24 |
| Condo Apartment | 97% | 37 |
Look past the price drops and the deal-making picture actually looks calm. Homes across every segment are still selling close to asking price. Semis are even selling slightly above asking. This isn’t a market full of desperate sellers slashing prices. It’s a market where sellers are pricing realistically from the start.
The real gap is in how long homes sit. Semis and detached homes are selling in under a month. Condos are taking noticeably longer, a sign of the extra supply still working through that segment.
Summer is naturally the slower season for real estate, and that usually means more room to negotiate, even if the average price ends up looking about the same as it did before or after summer. We’re not expecting a dramatic swing in either direction over the next few months. The economy is still a bit shaky and rates are still a factor, and that points toward stability rather than another sharp move up or down.
What’s more likely is real estate activity picking back up heading into fall, which should keep prices closer to average rather than pushing them lower. Right now, though, that summer slowdown gives buyers a real window to negotiate below average price, especially on properties that need work or aren’t the most desirable on paper.
The bigger picture points toward more stability. Buying activity has already picked up compared to last summer, and that looks likely to carry into fall and into next year. Even if rates creep up a little, more buyers coming back into the market tends to balance things out and keep prices steadier, not the other way around.
What Multiplex Investors Should Watch: Keep an eye on 416 semi-detached listings. A seller’s-market pace paired with falling prices is a narrow window. It won’t stay a buyer-friendly price with this kind of competition for long. If new listings keep shrinking here, expect prices to catch up to the pace within a couple of months.
Ready to Make Your Move?
July’s numbers make one thing clear: the properties still priced like it’s a down market are getting scarcer, especially for semis and detached homes in the city. Reading a shrinking new listings number and a rising SNLR takes more than a glance at the average price. It takes someone watching the pace underneath the price.
That’s the gap between a good buy and a missed one right now, and it’s where an experienced team pays for itself.
Our brokerage specializes in Toronto multiplexes. We’ll help you find deals, crunch the numbers, and guide you through renovations and management. If you want full support in Toronto multiplex investing, our team can help you:
- Find high-potential properties
- Crunch the numbers so you know exactly where you stand
- Coach you through renovations to maximize returns
- Lock in great tenants
- Provide full property management so your investment runs smoothly
Book a strategy session with us here and let’s map out the smartest move for your portfolio.

