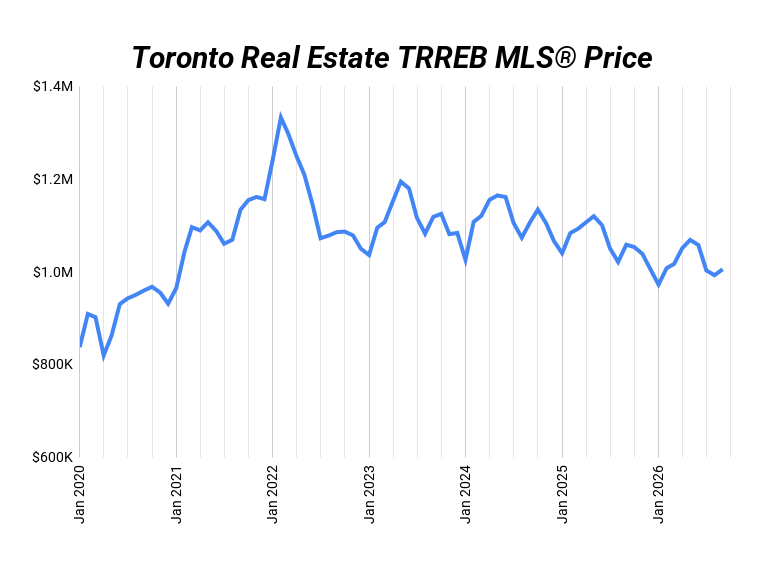
On the surface, September looks weak. The average GTA home sold for $1,006,409, down 5.1% from last year. Sales fell 9% to 5,040. New listings fell 14.4% to 16,500. Read the headlines and it sounds like prices are still sliding.
Underneath, the story is different. Prices have barely moved all year. September’s average is the same as last December’s. The drop happened in late 2025, and 2026 has held flat since. Supply is back to normal too, after two years of extra listings. What’s missing now is buyers. And with fixed mortgage rates rising again, the story of a quick recovery has faded. Most banks now expect prices to stay flat for a while.
Below, we break down what the numbers say, which home types are holding up, and what it all means for multiplex investors.
September 2026 Market Overview
| Metric | Sep 2025 | Sep 2026 | Change |
|---|---|---|---|
| Sales | 5,540 | 5,040 | -9.0% |
| Average Price | $1,060,036 | $1,006,409 | -5.1% |
| New Listings | 19,270 | 16,500 | -14.4% |
| Active Listings | 28,813 | 26,131 | -9.3% |
| Avg. Days on Market | 33 | 34 | +3.0% |
| SNLR | 28.7% | 30.5% | +1.8 pts |
Year over year, the main numbers all moved down. Sales fell 9%. The average price fell 5.1%. New listings fell 14.4%. Homes took about the same time to sell, 34 days versus 33 last September. But a year-over-year drop doesn’t mean prices are falling right now. It means they are lower than they were a year ago.
Look at 2026 month by month and prices have been flat. The average was $1,006,141 in December 2025. In September 2026, it was $1,006,409. Nine months later, the same price. In between, prices rose in spring to about $1.07 million in May and eased back over the summer. That is a normal seasonal pattern. The real drop happened in late 2025, when the average slid from $1.05 million in October to $968,468 in January.
The 10-year view adds context. New listings this September were right in line with the 10-year September average of about 16,190. In 2024 and 2025, they ran 12% and 19% above it. So the extra supply from the last two years is gone. Sales are the weak spot. At 5,040, they are 29% below the 10-year September average of about 7,060. Prices are back near 2020 levels and 25% below the 2022 peak. Remember, price is always the last thing to change. Supply and sales speed move first.
What Is SNLR and Why It Matters
SNLR stands for sales-to-new-listings ratio. It is one of the simplest ways to see who has the upper hand, buyers or sellers. You take the number of homes that sold in a month and divide it by the number of new homes that came on the market.
| SNLR | = |
|
Seller’s market (over 60%): More than 6 out of every 10 new listings sell. Homes go fast, and sellers can push on price.
Balanced market (40% to 60%): Buyers and sellers are on fairly even ground. Neither side has much extra power.
Buyer’s market (under 40%): Fewer than 4 out of every 10 new listings sell. Buyers have more choice and more room to negotiate.
| September SNLR | 2022 | 2023 | 2024 | 2025 | 2026 | Long-Run Avg. |
|---|---|---|---|---|---|---|
| All TRREB | 44% | 28% | 28% | 29% | 31% | 55% |
| 416 Semi | 47% | 32% | 34% | 37% | 39% | 67% |
| 416 Detached | 38% | 29% | 28% | 28% | 30% | 55% |
| 905 Detached | 47% | 29% | 28% | 29% | 30% | 55% |
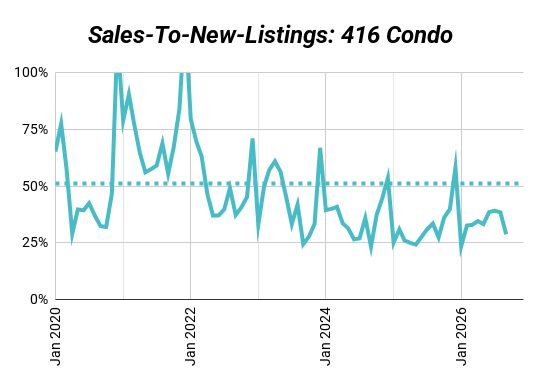
| 416 Condo | 37% | 24% | 23% | 27% | 29% | 51% |
This is the best September SNLR since 2022, at 31% for the GTA. From 2023 to 2025, it was stuck at 28% to 29%. Every home type in the table is a little higher than last year. That sounds like good news, and it is, but look at why. Sales didn’t rise. 5,040 is about the same as 2022 and 2024. The ratio improved because new listings came back down to normal.
That matters. In 2024 and 2025, there were extra listings on the market, likely from owners who needed to sell. That wave seems to have worked through. What’s left looks like ordinary turnover. Supply is now balanced. Demand is not. The GTA is still well under the 40% line, and under its long-run average of 55%. Buyers still have the upper hand.
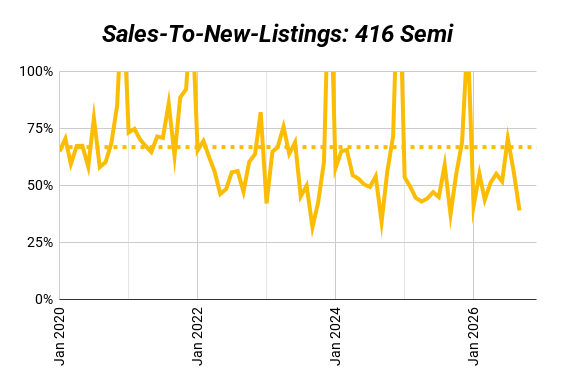
The table also shows which home types are strongest over time. Semis have the highest long-run SNLR at 67%, and they’ve beaten detached homes every September since 2022. Condos have the lowest at 51%. One note: TRREB’s own report shows an SNLR of 37.8%. That number is a 12-month average. Ours looks at September only, so we can compare it to past Septembers.
416 vs. 905 Detached: The Big Picture
| Sales | Sep 2025 | Sep 2026 | Change |
|---|---|---|---|
| 416 Detached | 675 | 640 | -5.2% |
| 905 Detached | 1,986 | 1,759 | -11.4% |
| New Listings | Sep 2025 | Sep 2026 | Change |
|---|---|---|---|
| 416 Detached | 2,377 | 2,146 | -9.7% |
| 905 Detached | 6,890 | 5,899 | -14.4% |
| Average Price | Sep 2025 | Sep 2026 | Change |
|---|---|---|---|
| 416 Detached | $1,686,013 | $1,562,966 | -7.3% |
| 905 Detached | $1,247,895 | $1,193,432 | -4.4% |
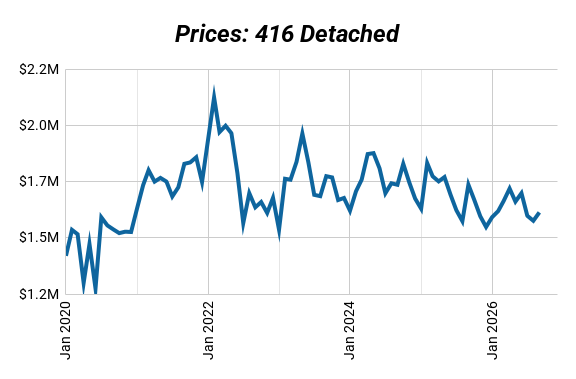
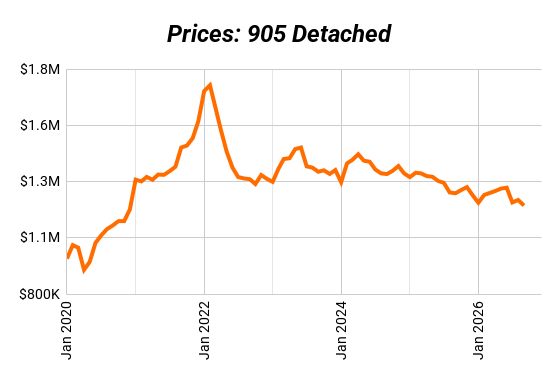
The 905 slowed down more than the city. Detached sales in the suburbs fell 11.4%, more than double the 5.2% drop in the 416. New listings fell 14.4% in the 905 and 9.7% in the city. Compared to the 10-year September average, 905 detached sales were 30% lower and new listings were right on target. City detached sales were 17% lower, with new listings 8% above average. Both markets have plenty of homes for sale. Both are short on buyers, with an SNLR of 30%.
Price moved the other way. The average 416 detached home fell 7.3% to $1,562,966, back to about where it was in September 2022. The 905 fell 4.4% to $1,193,432. That shrank the gap between city and suburb from $438,118 last year to $369,534. Over the longer run, though, the 905 has fallen more. It is about 31% below its peak of $1,727,963. The 416 is about 25% below its peak of $2,073,989.
For multiplex investors, the 416 detached market is where most conversions happen under the Toronto sixplex and multiplex rules. Right now, detached homes sell at 98% of asking and take 27 days on average. That means room to negotiate. But don’t read lower prices as a reason to rush. With rates rising and demand soft, detached prices are more likely to stay flat than bounce back. Buy for the cash flow the property makes today, not for a price jump tomorrow.
416 City Breakdown: Detached, Semi, and Condo
| Sales | Sep 2025 | Sep 2026 | Change |
|---|---|---|---|
| 416 Detached | 675 | 640 | -5.2% |
| 416 Semi | 214 | 211 | -1.4% |
| 416 Condo | 940 | 884 | -6.0% |
| New Listings | Sep 2025 | Sep 2026 | Change |
|---|---|---|---|
| 416 Detached | 2,377 | 2,146 | -9.7% |
| 416 Semi | 572 | 539 | -5.8% |
| 416 Condo | 3,431 | 3,073 | -10.4% |
| Average Price | Sep 2025 | Sep 2026 | Change |
|---|---|---|---|
| 416 Detached | $1,686,013 | $1,562,966 | -7.3% |
| 416 Semi | $1,181,672 | $1,207,884 | +2.2% |
| 416 Condo | $681,115 | $640,248 | -6.0% |
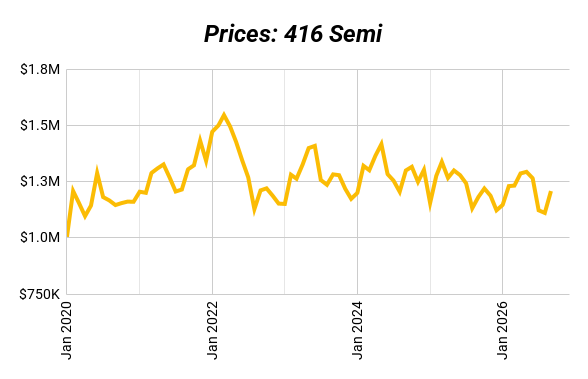
Inside the city, the three main home types tell three different stories. Semis are the only one where prices rose, up 2.2%. Their sales were almost flat too, at 211 versus 214. Detached and condo prices both fell about 6% to 7%. Every type saw fewer new listings than last year, which is helping keep the pile of homes for sale in check.
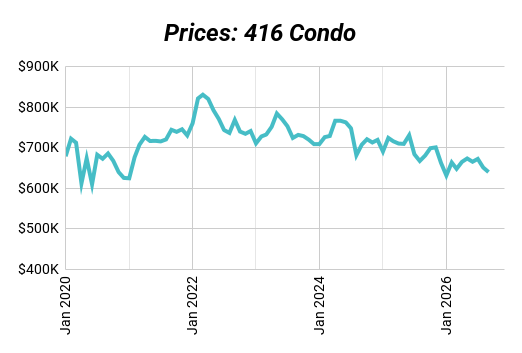
The 10-year view shows the gap even more clearly. Semi prices are about 7% above their 10-year September average. Detached prices are about 2% above theirs. Condos are the only one below, about 3% under their 10-year average of $657,388. Sales for all three are well below normal. Detached sales were 17% under the 10-year average, semis 18% under, and condos 31% under.
This split isn’t new. It follows the long-run pattern. Semis have always had the most buyers for the fewest homes. Condos have always had the most supply. When the market slows down, that pattern gets louder.
Detached: The average 416 detached home is $1,562,966, down 7.3% and back to 2022 levels. Listings are above normal, so buyers have choice and time. Expect prices to hold flat rather than climb while rates stay high.
Semi: The strongest home type in the city, and it has been for years. Semis are the most affordable house you can buy in Toronto, so more buyers compete for them. Supply is tight, with only 539 new listings. Prices are up 2.2% to $1,207,884, almost exactly where they were in September 2022. They sell in 21 days on average, for 104% of asking.
Condo: The weakest home type, and the weakest over the long run too. The average 416 condo is $640,248, back to 2019 levels. At the end of September, 5,329 condos were for sale, and only 884 sold that month. Condos took 40 days to sell, the longest of the three.
Hidden Market Signals
| 416 Home Type | Sale Price vs. Asking | Avg. Days on Market | Homes for Sale |
|---|---|---|---|
| Semi-Detached | 104% | 21 | 563 |
| Townhouse | 102% | 23 | 267 |
| Detached | 98% | 27 | 2,880 |
| Condo Apartment | 97% | 40 | 5,329 |
Average prices hide what is happening on the street. Sale price versus asking shows how hard buyers are competing. City semis sold for 104% of asking. In some areas, it was much higher. Semis in E01 (Leslieville and South Riverdale) sold for 113% of asking. W01 (High Park and Roncesvalles) hit 111%, and E02 (the Beaches) hit 110%. In these pockets, bidding wars never really left. Condos sit at the other end, at 97% of asking and 40 days on market.
The bigger signal isn’t in TRREB’s data yet. Fixed mortgage rates are rising again. CIBC and TD raised select fixed rates by 0.20% on September 29, following similar moves by the rest of the Big Six. The 5-year bond yield, which sets fixed rates, hit a one-year high in late September. Inflation in August was 3.0%, still above the Bank of Canada’s 2% target, so lower rates aren’t coming soon.
Here is why that matters for prices. Every time rates rise by half a point, the monthly payment on a mortgage goes up by about 5%. To keep prices where they are, buyers’ incomes or rents need to rise by about the same amount. If they don’t, prices have to come down to make the math work. Early in 2026, many people thought prices had hit bottom and would slowly recover. That story has faded. TD now expects prices to stay flat, with Ontario prices rising well under 1% because of weak population growth.
What Multiplex Investors Should Watch
Rents versus rates. Rising rates squeeze every investor’s cash flow. The only way through is rent growth or a better buy price. Run every deal at today’s rates, plus a half point, and see if it still works. Check your cap rate and use our total return calculator to test a few scenarios before you commit.
The condo pile. More than 5,300 condos are for sale in the city. Many owners who can’t sell will rent out their units instead. That gives tenants more choice and can slow rent growth. Your multiplex units need to win on space, layout, and finish. Ground-level homes with private entrances and outdoor space stand out against a condo.
Semis hold value, detached hold options. Semis keep their value best in a slow market, but you will compete for them. Detached homes cost more and sell slower right now, but they often have room for more units, like a garden suite or laneway suite. In a flat market, the value you create through extra units matters more than waiting for prices to rise.
Ready to Make Your Move?
September showed a market that has found its level. Prices have held flat all year, supply is back to normal, and semis keep proving they hold value best. But with fixed rates climbing again, nobody should count on prices rising to bail out a weak deal. In a flat market, the return comes from buying right and adding value, not from waiting.
That is where experience matters. Knowing which streets still see bidding wars, which properties can add units, and how a deal holds up when rates move is the difference between a property that pays you and one that costs you.
Our brokerage specializes in Toronto multiplexes. We’ll help you find deals, crunch the numbers, and guide you through renovations and management. If you want full support in Toronto multiplex investing, our team can help you:
- Find high-potential properties
- Crunch the numbers so you know exactly where you stand
- Coach you through renovations to maximize returns
- Lock in great tenants
- Provide full property management so your investment runs smoothly
Book a strategy session with us here and let’s map out the smartest move for your portfolio.

